



In DIVY's Q3 2026 review, the team breaks down third quarter performance, trade activity, and an outlook favoring opportunities beyond AI leaders.
HCM Insights
We spent much of the third quarter looking beyond the companies that led the market and asking where our next opportunities could come from. AI remains an important part of our investment thinking, but we have become more selective about how much to pay for its growth and how much the portfolio should depend on the same capital-spending cycle. Our conviction in the long-term opportunity has not disappeared. We do, however, want room for outcomes that differ from the market’s expectations, and we found several income-producing businesses elsewhere that we believe deserve a place alongside our technology holdings.
That thinking shaped our activity throughout the quarter. Included in the trading over the quarter was exiting Caterpillar and the remaining Applied Materials position, trimming Cisco and Alphabet, and directing capital toward a broader mix of opportunities. Lockheed Martin brought exposure to defense spending; Janus Living and Camden Property Trust added different ways to participate in improving real estate fundamentals; and PepsiCo offered an established dividend-paying franchise with room for operational improvement. We also built our position in RSPA, giving us more balanced exposure across large-cap equities through an income-generating, equal-weight approach. Please find a complete list and explanation of trades carried out over the quarter later in the letter.
As the quarter progressed, we also became more attentive to the signals coming from rates, currencies and our growth indicators. In September, rising European yields and renewed dollar strength prompted us to reduce broad international equity exposure. Within fixed income, we selectively added intermediate corporate bonds and Treasuries while retaining short-term liquidity and began broadening our mortgage allocation. We wanted to remain invested in opportunities we found attractive while preserving the flexibility to respond if the backdrop weakened.
Against that backdrop, the Tactical Income Composite generated a preliminary return of −0.26% gross / -0.39% net for the quarter, versus −0.22% for the primary benchmark*, a shortfall of approximately 4 basis points (bps) gross and 17 bps net. The Composite outperformed the secondary benchmark, the Morningstar Moderately Conservative Target Risk Index, by approximately 214 bps gross and 175 bps net; that index returned −2.40%. Year-to-date through September 30, the Tactical Income Composite returned +3.07% gross / +2.67 net, compared with +4.15% for the primary benchmark* and +3.09% for the secondary benchmark, trailing by approximately 108 bps gross / 148 bps net and 2 bps gross and 42 bps net, respectively.
We believe the strategy performed reasonably well this quarter, finishing close to the primary benchmark* and meaningfully ahead of the secondary benchmark, while remaining positive year to date. Our participation in the broader equity market should be viewed in the context of the low volatility and income strategy, which is Tactical Income. Every holding must provide yield, which prevents us from directly owning non-dividend paying companies that have contributed meaningfully to the market’s year-to-date leadership. Additionally, the covered-call ETFs held in the strategy are designed to generate income and moderate volatility, but can capture significantly less upside than their underlying equity markets during strong advances. These are deliberate trade-offs in how we construct Tactical Income. We remain focused on finding attractive opportunities within that framework, combining equity participation with diversified income and a disciplined approach to risk.
Macro and Market Landscape
The third quarter presented a challenging environment for fixed income investors, even as U.S. equities continued to advance. Equity markets remained supported by resilient earnings and continued enthusiasm surrounding artificial intelligence, although leadership remained concentrated in large-cap technology. Meanwhile, Treasury yields moved sharply higher as persistent inflation, elevated oil prices, and geopolitical tensions complicated the Federal Reserve's policy outlook. Following the Fed's 25-basis-point rate increase in September, the 10-year Treasury yield ended the quarter near 5.3%, creating a difficult backdrop for longer-duration bonds.
Despite these headwinds, our fixed income positioning proved beneficial relative to the benchmark*. Our reduced exposure to government duration, combined with an emphasis on shorter-duration corporate credit and structured income, helped cushion the impact of rising yields. Fixed income contributed approximately 47 basis points of relative outperformance, reinforcing our preference for actively managing duration rather than simply mirroring the benchmark*. Conversely, equity performance was constrained by our income mandate, particularly our limited exposure to non-dividend-paying technology companies.
Equities and Market Leadership
AI remained an important investment theme, but the opportunity set became more differentiated. We continued to favor companies with identifiable revenue, cash-flow and shareholder-return benefits from AI adoption. We became more cautious about treating growth in AI usage as a one-for-one predictor of future semiconductor and infrastructure capital expenditure. Better model efficiency, improved hardware utilization and changing data-center budgets can alter where value accrues.
Within technology, Microsoft, Apple, SAP and NVIDIA contributed positively to absolute results during the quarter, with technology holdings generally contributing positively rather than detracting from results. However, maintaining our targeted volatility of approximately mid-6% requires a disciplined approach to position sizing, particularly among the largest constituents of our primary benchmark. For example, benchmark-neutral allocations to NVIDIA and Apple would each represent positions exceeding 3% of the portfolio. While we remain constructive on both companies, we believe such concentrated exposures would introduce unnecessary volatility and potentially compromise our risk objectives. As a result, our more measured positioning can create a relative performance headwind when these stocks rally, even as our holdings contribute positively to absolute returns.
Elsewhere, Quest Diagnostics and Amgen provided support, while consumer discretionary holdings, including Home Depot, McDonald’s and TJX, weighed on results. The quarter’s experience supports continued diversification across company-specific earnings drivers rather than reliance on a single market narrative.
Credit and Liquidity
We retained a diversified fixed income mix spanning investment-grade corporate credit, government securities, AAA CLOs and mortgage exposure. With this, our fixed income sleeve overwhelmingly investment-grade as we believe current high-yield spread levels do not offer an attractive risk-reward opportunity. Additionally, short-term Treasury exposure and a lower government-bond allocation helped balance the portfolio’s sensitivity to rates. Selective duration additions were designed to improve participation if intermediate yields decline, while retaining liquidity and shorter-duration income elsewhere.
3Q26 Strategy Actions and Positioning
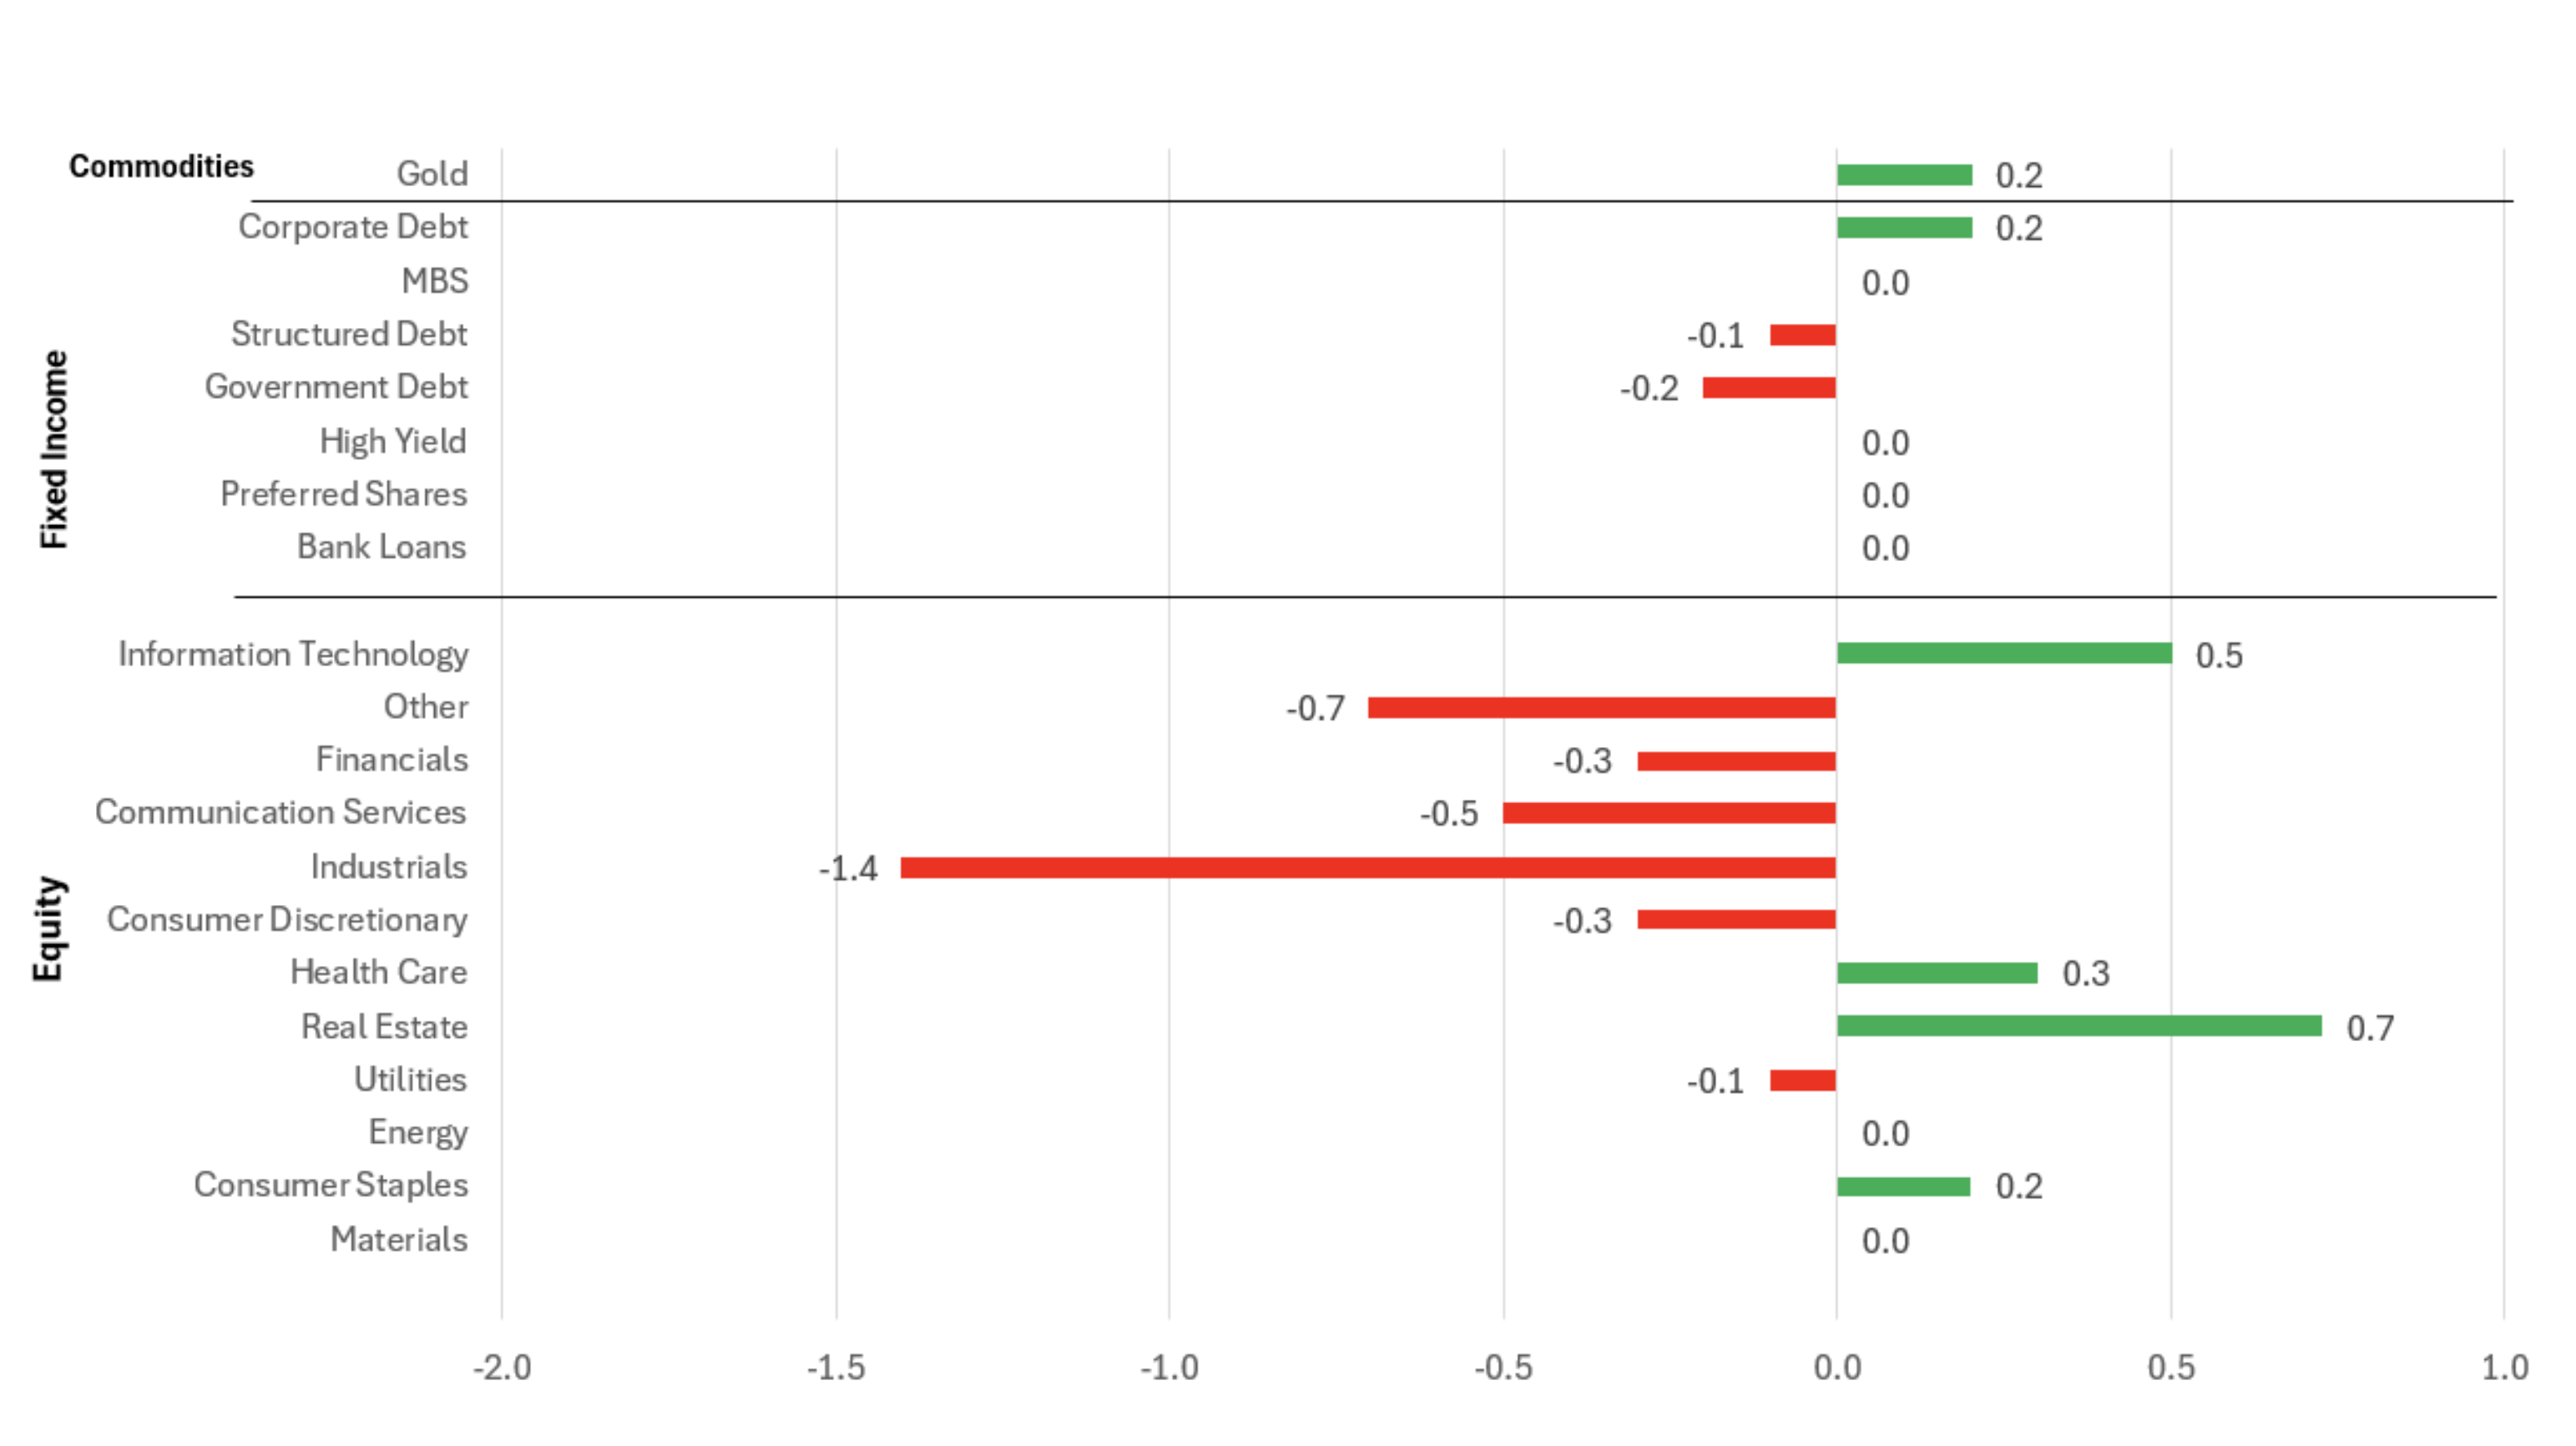
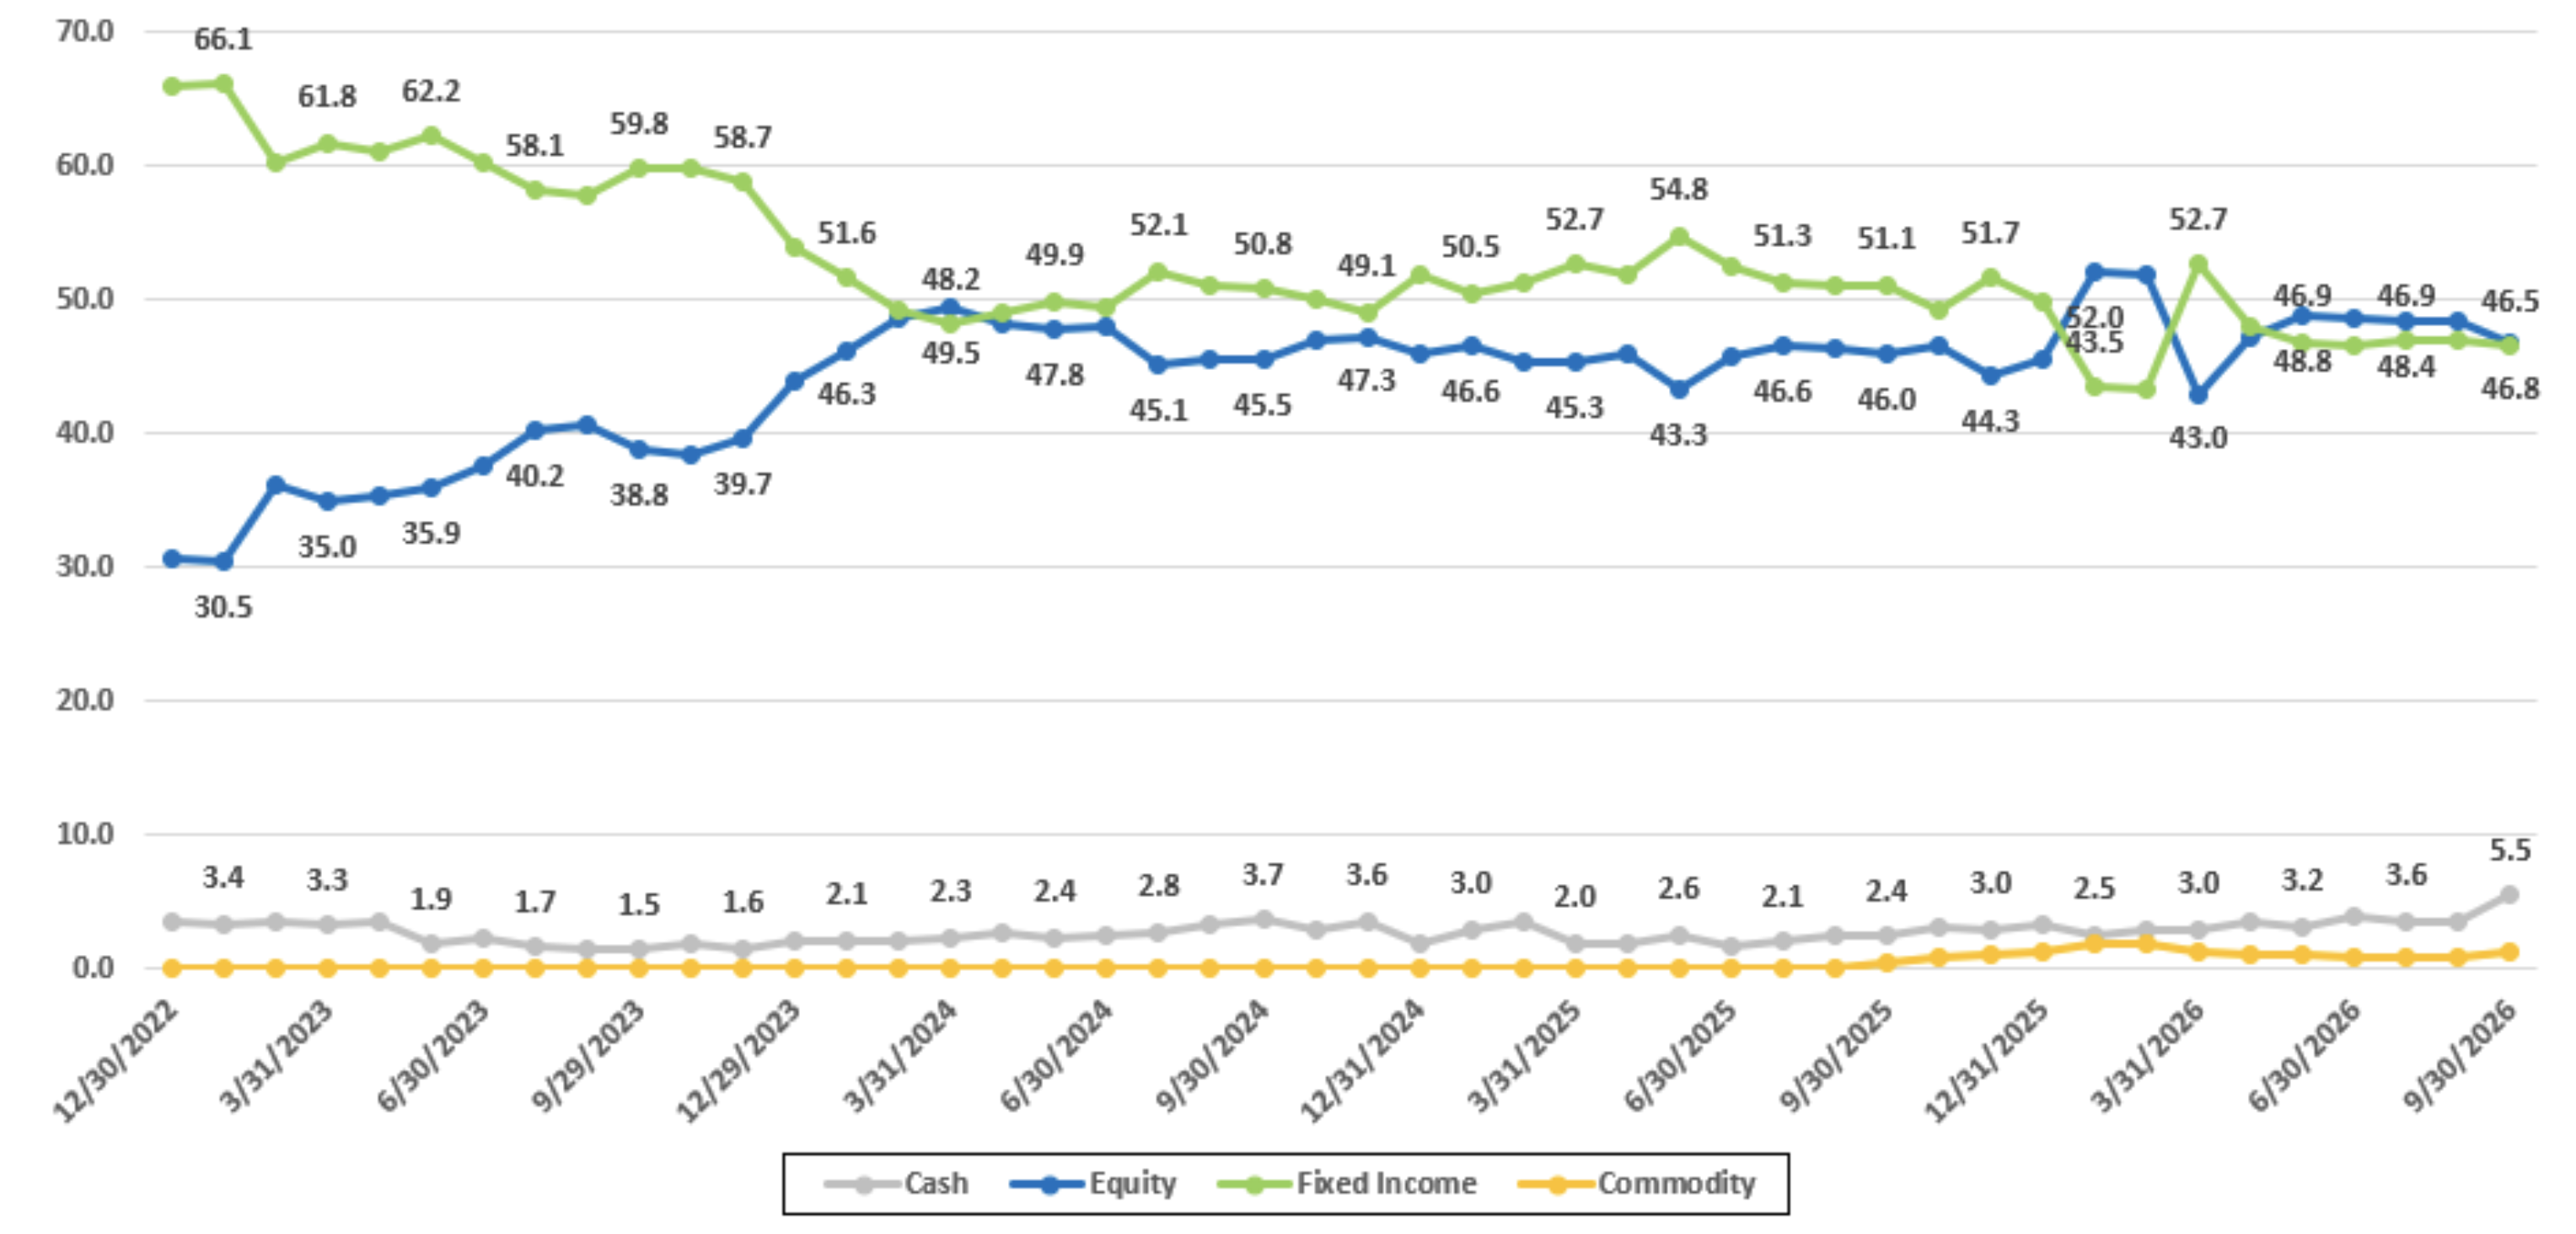
Activity fell into three broad phases: early-quarter diversification away from concentrated AI exposure; a mid-quarter increase in equal-weight income and selective duration; and late-quarter additions to dividend-oriented businesses alongside a reduction in international risk. The figures below show the change in asset allocation from June 30.
Figure 1: Tactical Income 3Q26 Sector Allocations Changes
×
![TI Figure 1 - Q326]()
Figure 1: Tactical Income 3Q26 Sector Allocations Changes
Source: Bloomerg as of 9/30/2026
Figure 2: Tactical Income Asset Allocation 12/30/22 – 09/30/26
×
![TI Figure 2 - Q326]()
Figure 2: Tactical Income Asset Allocation 12/30/22 – 09/30/26
Source: Bloomberg as of 9/30/2026
The trades listed herein encompass all transactions executed under the strategy during the third quarter (July 1 – September 30). This update is intended to offer a complete and transparent reflection of trading activity for third quarter of 2026.
1. Early-Quarter Diversification: Broadening Equity Income
In early July, we trimmed Caterpillar and Cisco. Caterpillar’s valuation and growing sensitivity to AI infrastructure expectations had reduced the margin for error. We also considered the risk that higher memory costs could redirect or delay other portions of data-center spending. We subsequently exited Caterpillar and initiated Lockheed Martin, adding a dividend-paying defense business with different demand drivers and a valuation we viewed as more attractive. We recognize Lockheed’s execution challenges but see potential from improved program performance and sustained defense spending.
The Cisco reduction was principally a position-sizing decision. We remained constructive on its networking opportunity and cash generation, but reduced exposure to control the contribution of a single holding to technology risk.
We sold the Goldman Sachs S&P 500 Premium Income ETF (GPIX) and initiated the Invesco S&P 500 Equal Weight Income Advantage ETF (RSPA), shifting part of our equity-income allocation toward an equal-weight approach with a covered-call overlay. This expressed our view that investment opportunities could broaden beyond the largest technology companies while maintaining distributable income. We also increased Vanguard Intermediate-Term Corporate Bond ETF (VCIT), pairing intermediate credit exposure with shorter-duration holdings elsewhere in fixed income.
Later in July, we exited Truist following a reduced revenue outlook, pressure on net interest income and uncertainty around a leadership transition. The proceeds increased RSPA. We also initiated Janus Living, adding senior housing exposure supported by demographic demand, constrained new supply and potential occupancy improvement. We sized the position modestly given geographic concentration, sponsor control and execution risks.
2. Mid-Quarter Refinement: Equal Weight and Selective Duration
In August, we exited Honeywell Aerospace following disappointing operating results, reduced guidance and ongoing supply-chain issues. Strong demand alone was insufficient to offset our concerns about execution and management credibility. We redirected the capital into RSPA as market breadth continued to expand.
We also trimmed Alphabet and increased RSPA again, bringing the latter’s target weight to approximately 2.5%. Alphabet remained an important exposure, including through its income-paying mandatory convertible, but we became more cautious about competitive differentiation in AI and the valuation assigned to future infrastructure monetization. The reduction diversified the sources of equity risk while retaining participation in Alphabet’s business.
We increased the FT Vest Gold Strategy Target Income ETF (IGLD), maintaining gold-related exposure through an income-producing vehicle. Separately, we shifted part of the iShares 0–3 Month Treasury Bond ETF (SGOV) allocation into Vanguard Intermediate-Term Treasury ETF (VGIT). This added measured rate sensitivity without eliminating the liquidity provided by short-term Treasuries as we wanted to take advantage of higher yields in the treasury market.
3. Late Quarter Discipline: New Earnings Drivers and Bond Flexibility
In September, we initiated PepsiCo. We viewed its valuation and dividend as attractive relative to the potential for stabilization in North America and continued international growth. The position added a consumer-staples earnings stream outside the AI infrastructure cycle, with a modest initial allocation reflecting the work still required to improve domestic execution.
We exited the remaining Applied Materials holding and initiated Camden Property Trust. The Applied Materials sale continued our effort to reduce dependence on the most capital-intensive part of the AI cycle. We remain constructive on AI adoption, but believe stronger adoption can coexist with more efficient use of existing hardware and a less predictable equipment-spending path.
Camden offered a different set of potential catalysts: improving leasing trends, easing new apartment supply and a healthy resident base. We also viewed its balance sheet and the relationship between private-market property values and its public equity valuation favorably. We began with a 0.50% target weight because the operating recovery was still early and exposure to the Washington, D.C. market remained a risk.
We reduced Vanguard International High Dividend Yield ETF (VYMI) from approximately 4% to 2%. The decision reflected our view of continued weak European economic growth and a stronger US dollar. We retained the remaining international exposure for flexibility to rebuild it if fundamentals and market conditions improve.
Late in September, we exited iShares 1–5 Year Investment Grade Corporate Bond ETF (IGSB) and increased VCIT. This moved a portion of short-duration corporate exposure into intermediate investment-grade credit to once again take advantage of higher yields. We also trimmed Simplify MBS ETF (MTBA) and initiated JMTG, beginning a shift toward a more actively managed mortgage allocation.
JMTG’s broader opportunity set across agency mortgages, collateralized mortgage obligations, non-agency mortgages and other mortgage structures gives the manager additional tools for security and collateral selection. We expect its role to depend on relative value, prepayment risk and portfolio diversification rather than a single directional interest-rate view.
Taken together, these decisions preserved equity participation while spreading risk across more business models and income sources. Within fixed income, selective duration additions were balanced against liquidity and shorter-duration holdings. The intent was to improve the portfolio’s flexibility as growth and inflation signals evolved, without abandoning the income requirement that defines Tactical Income.
3Q Attribution Snapshot
All performance is preliminary and unaudited.
- Third quarter: Tactical Income Composite −0.26% Gross / -0.39% Net; primary benchmark* -0.22 relative return ~ -4 bps gross / 17 bps net
- Year to date: Tactical Income Composite +3.07% Gross / 2.67% Net; primary benchmark* +4.15%; relative return ~ −108 bps gross / -148 bps net
- Secondary benchmark: −2.40% for the quarter and +3.09% year to date; Tactical Income outperformed by +214 bps gross / +175 bps net for the quarter and trailed by 2 basis points gross and 42 bps net year to date.
- Yield on the Portfolio as of 9/30/26 was 4.42%.
- The 1 year standard deviation of the Portfolio was 5.8%
- Asset allocation was a positive relative contributor at 69 basis points, broadly offset by negative security selection.
- The strategy’s equity sleeve contributed approximately +44 basis points to absolute return, but the benchmark’s* equity sleeve contributed approximately +91 basis points.
- The strategy’s fixed income sleeve contributed approximately -67 basis points to absolute return, but the benchmark’s* fixed income sleeve contributed approximately-114 basis points.
- Average exposures during the quarter were approximately 48.25% equity, 47.73% Fixed Income, 2.85% cash, and 1.16% commodities.
- At quarter-end, equity allocation had slightly decreased to 46.5% while Fixed Income and commodities remained relatively unchanged at 47.7% and 1.2% respectively. Cash slightly increased to 4.6% due to equity sales / trims for company-specific reasons.
- Top five relative position securities-level contributors included SAP Sponsored ADR (+20bps), Vanguard International High Dividend Yield (VYMI) (+19bps), JP Morgan Nasdaq Equity Premium Income (JEPQ) (+17bps), iShares 0-3 Month Treasuries (SGOV) (+8bps), Janus Henderson AAA CLO ETF (JAAA) (+5bps).
- Bottom five relative detractors included NVDA (-23bps), Applied Materials (-20bps), Home Depot (-11bps), AstraZeneca (-10bps), Apple (-10bps).
- At the sector level, Communication Services (-20bps), Energy (-18bps), Consumer Discretionary (-14bps), and Healthcare (-11bps) were the largest drags due to our non-ownership in META, Chevron, and Amazon (non-dividend) mixed with our ownership in Home Depot and AstraZeneca.
- The modified duration of the fixed income sleeve was 3.4 with an average credit rating of A.
Market Outlook
We remain constructive on the opportunity to earn income and participate in long-term business growth, but believe selectivity is increasingly important. Within AI, our focus is on where spending becomes durable revenue and cash flow, how competition changes returns on investment, and whether valuations already discount an unusually favorable outcome. Reducing selected hardware and infrastructure positions does not represent a wholesale exit from AI. It reflects a preference for a more balanced mix of businesses and a willingness to change exposures as the economics evolve.
Beyond technology, we see opportunities in defense, senior housing, multi-family apartments, consumer staples and other dividend-paying businesses with company-specific catalysts. Broadening the portfolio’s sources of earnings is especially valuable when many securities respond to the same assumptions about AI spending, interest rates or market momentum.
Within fixed income, we believe active duration management and sector positioning will remain important drivers of performance. With intermediate and long-term treasury yields having risen meaningfully over the past month, we see an increasingly attractive opportunity to extend portfolio duration, positioning the strategy to benefit from higher yields.
As we look back on the first nine months of 2026, we are encouraged by the strategy's performance and believe the results demonstrate the importance of maintaining a disciplined, income-oriented approach. While the S&P 500 has delivered strong double-digit gains, Tactical Income is designed with a different objective: to provide attractive income, participate in equity market appreciation, and manage volatility across varying market environments. With approximately 40% beta-adjusted equity exposure, we would not expect the strategy to capture the full upside of an equity market rally, particularly during periods when fixed income returns are negative.
This distinction has been especially important in 2026 as much of the equity market’s strength has been concentrated in a relatively narrow group of technology and semiconductor companies, many of which do not pay dividends and therefore fall outside our investment mandate. Companies such as Micron, AMD, and Amazon have meaningfully contributed to the S&P 500’s performance, creating a structural headwind for our income and lower-volatility focused strategy.
Importantly, we believe the strategy continues to deliver on its core objectives. Our fixed income positioning has outperformed its benchmark*, volatility has remained well controlled, and the strategy continues to generate an attractive yield. We are also encouraged by our performance relative to more comparable diversified and dividend-oriented benchmarks, which reinforces the value of evaluating Tactical Income within the context of its investment mandate.
Looking ahead, we remain optimistic about the opportunities across both equities and fixed income. Our focus remains on delivering competitive total returns while generating consistent income and maintaining the flexibility to navigate changing market conditions. We appreciate your continued confidence in Hilton Capital Management and look forward to building on the progress made throughout 2026.
Sincerely,
The Hilton Tactical Income Investment Team
*Benchmark = 40% SP500 TR Index / 60% Bloomberg Intermediate US Govt/Credit TR Index Value Unhedged
Important Disclosures:
Hilton Capital Management, LLC (“HCM”) is a Registered Investment Advisor with the US Securities Exchange Commission. The firm only transacts business in states where it is properly notice-filed or is excluded or exempted from registration requirements. Registration as an investment advisor does not constitute an endorsement of the firm by securities regulators nor does it indicate that the advisor has attained a particular level of skill or ability.
The views expressed in this commentary are subject to change based on market and other conditions. The document contains certain statements that may be deemed forward looking statements. Please note that any such statements are not guarantees of any future performance and actual results or developments may differ materially from those projected. Any projections, market outlooks, or estimates are based upon certain assumptions and should not be construed as indicative of actual events that will occur.
All information has been obtained from sources believed to be reliable, but its accuracy is not guaranteed. Sources include: Bloomberg and INDATA (our portfolio accounting and performance system). There is no representation or warranty as to the current accuracy, reliability or completeness of, nor liability for, decisions based on such information and it should not be relied on as such.
The S&P 500 Total Return Index, often referred to as SPX TR, is a version of the S&P 500 index that includes both capital gains and dividends. Unlike the standard S&P 500 Price Return Index (SPX), which only reflects changes in stock prices, the SPTR reinvests dividends paid by the companies in the index, providing a more comprehensive measure of investment performance. We believe that this makes it a better benchmark for evaluating the actual returns an investor might receive.
The Bloomberg Intermediate US Government/Credit TR Index Value Unhedged Index is a broad-based benchmark that measures the non-securitized component of the Bloomberg US Aggregate Index with maturities less than 10 years. It includes: investment-grade, US dollar-denominated, fixed-rate Treasuries, government-related securities, and corporate bonds. The "Total Return (TR)" aspect means it includes interest income and price appreciation. "Unhedged" indicates that it does not use currency hedging, which is relevant for international investors.
The composite performance information contained herein is unaudited, was calculated by HCM and is shown on both a gross-of-fee and net-of-fee basis. The performance results herein include the reinvestment of dividends and/or other earnings, and the net-of-fee performance results are shown net of the actual advisory fees paid by the client accounts in the HCM Tactical Income Composite. In addition, actual client accounts may incur other transaction costs such as brokerage commissions, custodial costs and other expenses. Accordingly, actual client performance will differ, potentially materially, particularly given that the net compounded impact of the deduction of investment advisory fees over time will be affected by the amount of the fees, the time period, and the investment performance. For additional information about the composite, please contact us - info@hiltoncm.com