



This strategic partnership reflects complementary investment expertise in fixed income, inflation-sensitive and small-cap equity strategies while preserving New Century Advisor's investment approach.
HCM Insights
The Allman Brothers Band left a lasting mark on rock music with its distinctive blend of Southern rock, blues and improvisational jams. The band experienced plenty of ups and downs, to put it mildly, and its 1975 album Win, Lose or Draw was initially viewed as falling short of the standard set by its earlier work. That may be true, but the view of the album has improved with age, and retrospective reviews have been more favorable. The album includes a personal favorite, the beautiful instrumental “High Falls,” and serves as the framework for our quarterly missive.
Win: Solid Absolute Return
The Small & Mid Cap Opportunities composite returned 13.9% gross and 13.7% net for the three months ended June 30 (preliminary). Investors embraced a more aggressive risk-on posture during the quarter, driving strong gains in lower-quality and higher-valuation stocks across the small- and mid-cap market. We adjusted at the margin, selectively adding exposure to several companies that ranked lower on our quality spectrum and allowing valuations to run further before trimming. These were measured adaptations to the market environment, not a departure from our investment discipline.
The pressure on AI-related stocks at the end of the first quarter gave way to strong gains in the second, and our holdings participated in the rebound. AI has long been an important component of our Digital Infrastructure theme, giving the strategy meaningful exposure to the ongoing buildout. Within semiconductors and semiconductor capital equipment, MACOM Technology, MKS Instruments and Entegris were notable contributors. Other holdings with exposure to AI-related investment, including Dycom, TD SYNNEX and nVent, also added to the strategy’s return.
However, several holdings detracted from performance during the quarter. Primoris, which had previously been a strong contributor, declined after reporting significant cost overruns on six large solar projects. The magnitude of the shortfall, limited visibility into the ultimate financial impact and our reduced confidence in management led us to exit the position. Planet Fitness also declined following another reset in earnings expectations. The company’s updated marketing campaign appears to have missed the mark, contributing to sluggish revenue growth and raising questions about whether the brand still resonates with parts of its core customer base. Management has acknowledged the issues and has represented that they are taking steps to address them. We continue to view Planet Fitness as a valuable franchise and have retained the position while monitoring execution closely.
The two situations also illustrate how valuation informs both our sell discipline and our willingness to be patient. Primoris’s exposure to high-growth end markets had driven a significant expansion in its valuation multiple, and we had been trimming the position as the shares appreciated. Even after those reductions, the combination of a still-elevated valuation, limited visibility and a deteriorating outlook left us concerned about further downside, leading us to exit the remaining position. Planet Fitness presents a different setup. Following another reset in earnings expectations, the shares now trade at a valuation that, in our view, provides a measure of downside support. That does not eliminate the execution risks, but it gives us greater comfort maintaining the position while management works to improve performance.
Trading activity remained within our normal range, with turnover of roughly 7% during the quarter. Still, the combination of our trading and market appreciation changed the shape of the strategy more than the turnover figure might suggest. Our Technology weight increased by more than five percentage points, even though net purchases accounted for only a little more than 50 basis points of that increase. We continued to manage position sizes but also gave some of our winners more room to run.
Industrials tells a similar story. Our net addition of roughly 30 basis points does not tell the whole story. The sector includes several of our AI-related holdings outside Technology, and we trimmed a number of those positions as they appreciated. At the same time, we shifted capital into several new holdings that fit our emerging Manufacturing and Industrial Rebound theme.
Lose: A One-Two Punch and Trailing Relative Performance
We believe the excitement surrounding the AI buildout is justified and grounded in fundamentals, and the opportunity is well represented in the strategy. However, we value diversification and invest with discipline, deliberately avoiding overconcentration in any one theme or area. Previous technology booms, including the dot-com era, have shaped our approach. During the boom phase, investors clamor for exposure, driving dizzying gains. Hype can push stocks to unsustainable levels, and ultimately not every highflier proves to be a winner. Missing a couple of the quarter’s biggest winners weighed on our relative performance, as did the trims we made to maintain balance in the strategy. But our goal was (and remains) to maintain healthy exposure to AI without allowing it to dominate the strategy. Put differently, we aim to participate in the upside without becoming overly exposed if and when these stocks correct.
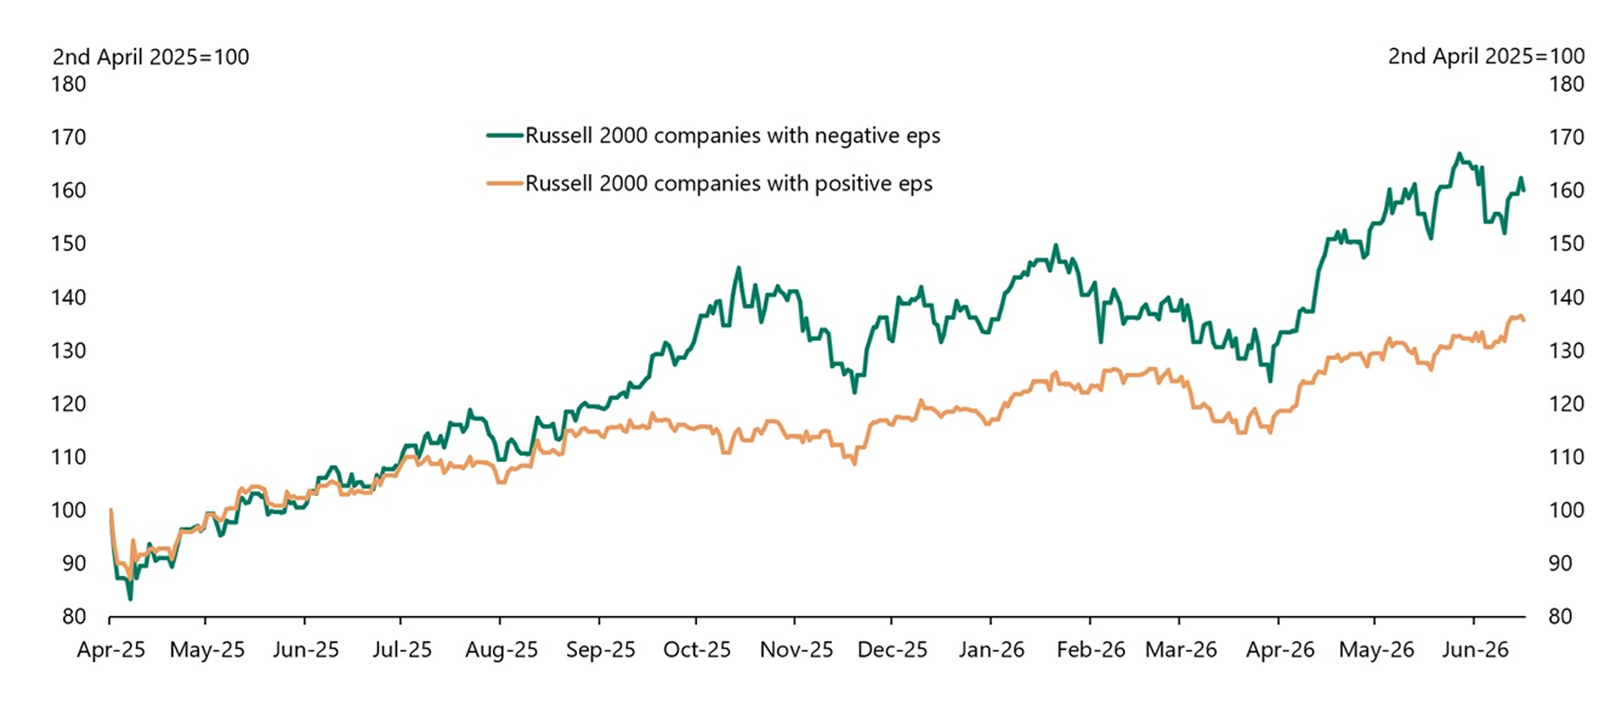
The first punch came during the initial phase of the SMID-cap recovery, when broad market repositioning favored lower-quality companies and those with negative earnings.
Companies with negative earnings continue to outperform companies with positive earnings
×
![Line chart comparing the Equal-weighted]()
Companies with negative earnings continue to outperform companies with positive earnings
Source: Bloomberg, Apollo Chief Economist
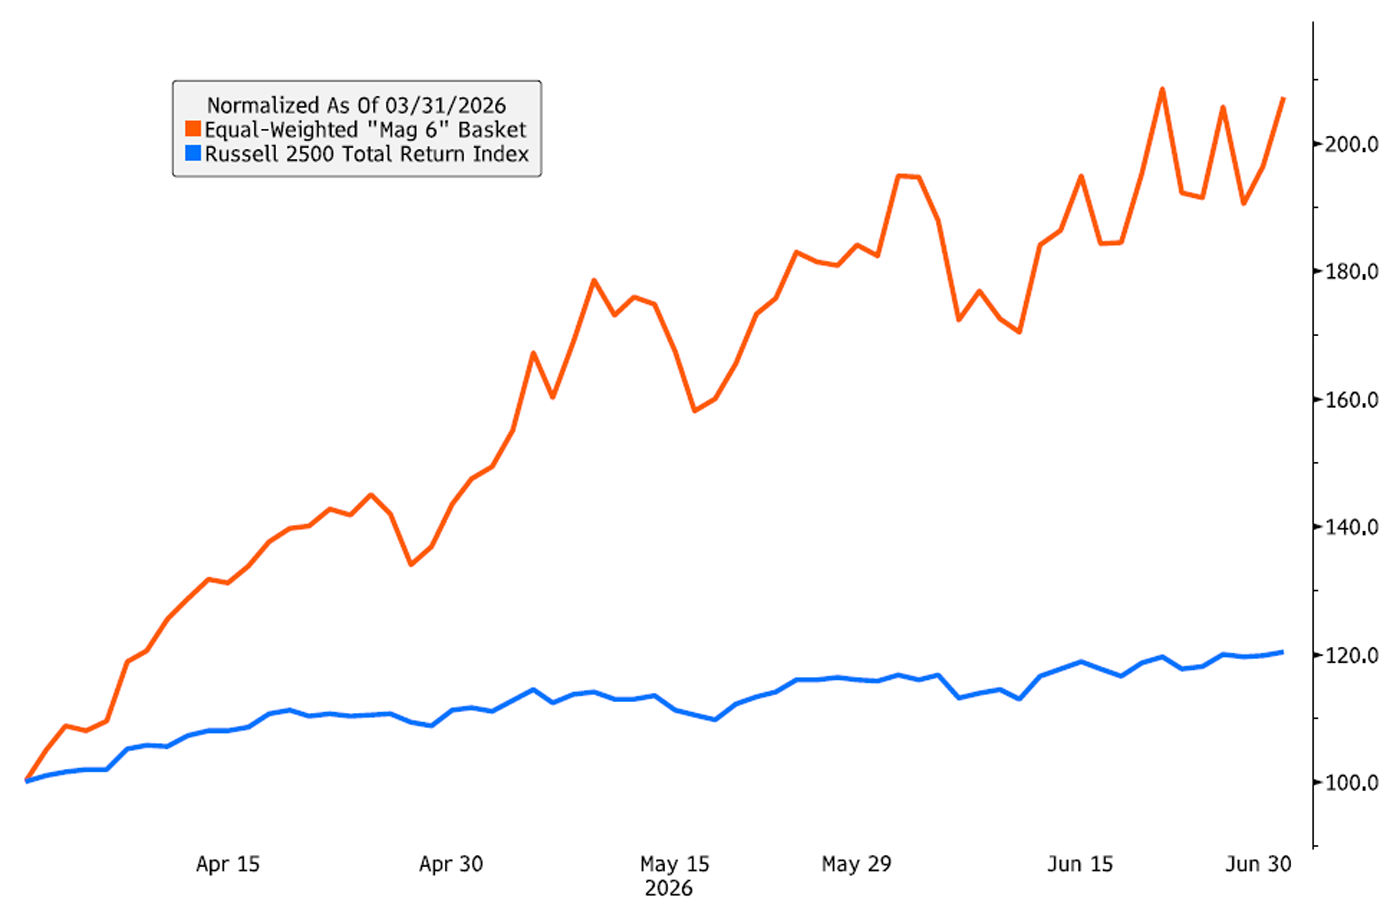
Typically, we would expect the market to become more discerning as a recovery matures. This time, however, the second punch came from the outsized gains of a narrow group of AI-related stocks, particularly companies tied to memory, storage and optical communications. Six stocks – Sandisk, Flex Ltd., Coherent, Credo, MKS Instruments and Ciena – accounted for more than one-fifth of the Russell 2500’s 20.3% return during the quarter. We refer to this group as the “Mag 6.” While we did not own Sandisk, the group’s strongest performer, we did own MKS Instruments and Ciena. The chart below illustrates the magnitude of the group’s outperformance.
Figure 2
×
![Line chart comparing Russell 2000 companies with negative earnings per share (green) and positive earnings per share (orange), normalized to 100 on April 2, 2025. From April 2025 through June 2026, both groups trend upward, but companies with negative earnings consistently outperform, ending near 160 versus about 135 for companies with positive earnings.]()
Figure 2
Source: Bloomberg
Note: The "Mag 6" basket is a hypothetical, equal-weighted basket consisting of SNDK, FLEX, CRDO, MKSI, COHR, and CIEN. Performance is normalized to 100 as of 3/31/2026 and shown for illustrative purposes only.
Taken together, the early rally in lower-quality companies and those with negative earnings, followed by the concentration of returns in the “Mag 6,” left us with a deeper and more persistent relative-performance shortfall than we typically experience. In our view, the Small & Mid Cap Opportunities composite delivered a strong absolute return in the second quarter and remained true to our process, even as the unusually narrow market leadership left us trailing the Russell 2500.
Draw: The Current State of Affairs and the Look Ahead
After bottoming on March 30, the SMID-cap market continued to move mostly higher through the second quarter, though a barrage of business and geopolitical developments produced plenty of volatility along the way. The third quarter has begun with no shortage of noise. The conflict with Iran remains fluid, and a new Federal Reserve chairman is in place.
Like the rest of the market, we are watching to see how Federal Reserve policy evolves under the new leadership, although the early emphasis appears to focus squarely on returning inflation to target. That could require tighter financial conditions and some adjustment in risk assets. Over time, however, lower and more stable inflation could temper excessive risk-taking, create a more sustainable market backdrop and give companies better visibility into costs and margins. We believe the market can absorb that transition, and such an environment could be well suited to our investment approach.
AI-related capital spending, improving cyclical indicators and the wealth effect from rising asset prices have so far outweighed these concerns, helping sustain activity in the upper half of the K-shaped economy. Expectations for solid earnings growth and a labor market that remains healthy, if somewhat atypical, give us further reason for optimism. Over time, stock prices tend to follow earnings, and current consensus estimates call for double-digit growth. The outlook is particularly encouraging for small- and mid-cap companies, whose earnings are projected to outpace those of large-cap companies in both 2026 and 2027. That relative growth advantage could bring renewed investor attention to the asset class.
| Consensus EPS Growth Estimates by Market Capitalization Segment | ||
| 2026 EPS Growth (Est) | 2027 EPS Growth (Est) | |
| S&P 500 Index | 24.0% | 16.2% |
| Russell 2500 Index | 33.7% | 21.2% |
| Russell 2000 Index | 23.5% | 38.1% |
Source: Bloomberg. Consensus calendar year earnings growth estimates as of 7/16/26.
We expect AI spending to remain strong, but the theme is hardly undiscovered. Recent volatility in AI-related stocks suggests that expectations are high and positioning has become crowded. At the same time, after a prolonged period of subdued activity, conditions in parts of the industrial economy appear to be improving. Better earnings trends and more attractive valuations are broadening the opportunity set, reinforcing our view that a Manufacturing and Industrial Rebound is emerging as an investable theme.
We remain constructive, but the mix of positives and negatives makes “Draw” an appropriate title for our outlook. To some extent, we are driving with two feet: one on the gas and one on the brake. We have adjusted the strategy to reflect current market conditions without abandoning our preference for durable, high-quality businesses. If some of today’s uncertainties begin to clear, we have room to become more aggressive, both by adding to existing positions and initiating new ones. If risks intensify, we are prepared to become more defensive. Recent volatility, particularly among AI-related stocks, reinforces our view that a measured approach remains prudent.
Win, Lose or Draw followed Brothers and Sisters, an absolute classic. That helps explain some of the album’s lukewarm reception. In our business, we would call it “tough comps.” Over time, however, fans and critics have come to appreciate that there was still plenty of good music on the record, even if it did not quite clear the bar set by its predecessor. The Small & Mid Cap Opportunities composite’s second quarter was similar: the strategy generated what we believe is a strong absolute return but did not keep pace with the Russell 2500. We believe the quarter is best viewed as part of a longer track record and, perhaps, it too will age well.
Thank you for your continued interest in Small & Mid Cap Opportunities.
Small & Mid Cap Opportunities 2Q26 Review
| Composite 2Q26 Return | 13.9% gross/13.7% net (preliminary) |
| Composite YTD Return | 15.8% gross/15.5% net (preliminary) |
| 2026 Turnover | 7.4% |
| YTD Turnover | 16.8% |
| 2Q26 Biggest Contributors by Sector | Technology, Industrials, Healthcare |
| 2Q26 Five Biggest Contributors by Stock | MKSI Instruments, MACOM, Dycom, SYNNEX, nVent |
| 2Q26 Biggest Detractors by Sector | Energy, Utilities (only 2 negative sectors) |
| 2Q26 Five Biggest Detractors by Stock | Primoris, Planet Fitness, EQT Corp., BJ’s Wholesale, Jack Henry |
| 2Q26 New Names: | Akamai, Willscot Holdings, OSI Systems, Flowserve |
| 2Q26 Names Eliminated | Ashland Inc., Digital Bridge (takeout), Primoris |
| Holdings At Beginning of Quarter | 61 |
| Holdings At End of Quarter | 62 |
Important Disclosures:
Hilton Capital Management, LLC (“HCM”) is a Registered Investment Advisor with the US Securities Exchange Commission. The firm only transacts business in states where it is properly notice-filed or is excluded or exempted from registration requirements. Registration as an investment advisor does not constitute an endorsement of the firm by securities regulators nor does it indicate that the advisor has attained a particular level of skill or ability.
The views expressed in this commentary are subject to change based on market and other conditions. The document contains certain statements that may be deemed forward looking statements. Please note that any such statements are not guarantees of any future performance and actual results or developments may differ materially from those projected. Any projections, market outlooks, or estimates are based upon certain assumptions and should not be construed as indicative of actual events that will occur.
All information has been obtained from sources believed to be reliable, but its accuracy is not guaranteed. Sources include: Bloomberg and INDATA (our portfolio accounting and performance system). There is no representation or warranty as to the current accuracy, reliability or completeness of, nor liability for, decisions based on such information and it should not be relied on as such.
The performance information contained herein is unaudited, was calculated by HCM and is shown on both a gross-of-fee and net-of-fee basis. The performance results herein include the reinvestment of dividends and/or other earnings, and the net-of-fee performance results are shown net of the actual advisory fees paid by the client accounts in the HCM SMID Cap Composite. In addition, actual client accounts may incur other transaction costs such as brokerage commissions, custodial costs and other expenses. Accordingly, actual client performance will differ, potentially materially, particularly given that the net compounded impact of the deduction of investment advisory fees over time will be affected by the amount of the fees, the time period, and the investment performance. For additional information about the composite, please contact us - info@hiltoncm.com
All investing involves risks including the possible loss of capital. Asset allocation and diversification does not ensure a profit or protect against loss. Please note that out- performance does not necessarily represent positive total returns for a period. There is no assurance that any investment strategy will be successful. All investments carry a certain degree of risk. Dividends are not guaranteed, and a company’s future ability to pay dividends may be limited.
Additional Important Disclosures may be found in the HCM Form ADV Part 2A, which can be found at https://adviserinfo.sec.gov/firm/summary/116357.