HCM Insights

The third quarter of 2025 reflected a continuation of many of the same themes that defined the first half of the year, persistent inflation, narrow equity leadership, and elevated fiscal spending, but with a clear shift toward decelerating growth data and rising expectations for a 2026 rate-cut cycle. Market sentiment oscillated between optimism surrounding AI-driven capital investment and caution over sticky services inflation and widening deficits. Despite these crosscurrents, risk assets finished the quarter higher, powered again by a concentrated group of technology leaders.
Against this backdrop, the Hilton Tactical Income Strategy composite returned 3.89% gross / 3.77% net, underperforming the benchmark* by approximately 21bps. This relative shortfall was largely driven by non-ownership of several non-yielding, high volatility mega-cap AI leaders, notably NVDA (-54bps), TSLA (-27bps), and Broadcom (-20bps), which we cannot hold in material weights due to their lack of income distribution and / or requirement to maintain a consistent portfolio volatility. With these adjustments, relative performance reflected both the benefits of disciplined risk management and the cost of underexposure to a handful of long-duration AI equities that once again dominated returns. Despite these structural headwinds, the strategy performed relatively well, capturing the majority of market upside through disciplined exposure to dividend-supported AI enablers and high-carry credit positions. Year-to-date, the Tactical Income Strategy composite has delivered 7.50% gross / 7.11% net versus 9.32% for the benchmark, maintaining a defensive posture with an attractive forward yield and below-average volatility.
Macro & Market Landscape
The quarter unfolded amid clear signs of cooling in labor and consumption, but inflation progress remained uneven.
- Inflation & Rates: Core personal consumption expenditures (PCE) hovered above 2.8% year-over-year, still above target. Treasury yields initially rose as fiscal concerns persisted but fell back sharply late in the quarter as growth data softened. The 10-year yield ended near 4.2% after nearly touching 4.5%. The curve steepened modestly as markets began to price multiple rate cuts for 2026.
- Fiscal Dynamics: Deficits remained elevated, with spending tied to industrial policy and energy transition incentives offsetting modest tariff-related revenue gains. Treasury supply continued to pressure the long end of the curve, keeping real rates elevated despite easing growth.
- Equities: Equity markets were once again driven by AI-related mega caps, with NVDA, MSFT, and GOOGL contributing disproportionately to index performance. Broader market participation remained thin as value and dividend segments lagged.
- Credit & Liquidity: Credit spreads remained tight (<3%), buoyed by strong demand for yield and limited new issuance. Loan and CLO markets softened modestly late in the quarter as risk appetite rotated toward intermediate-duration IG credit.
Overall, the third quarter reinforced a regime of "higher-for-longer" nominal rates but slowing real growth, favoring short-duration carry and high-quality income over speculative beta exposure.
Tactical Income Strategy 3Q25 Review:
Portfolio Positioning & Key Trades
Portfolio activity followed a disciplined progression aligned with evolving macro signals along with specific stock / sector fundamentals. Overall, we held our equity exposure relatively constant with the average weight at 46.5% for the quarter, while continuing to increase our duration and diversify out of several of our floating rate fixed income securities in anticipation of fed rate cuts. Cash and Fixed Income weights remained at similar weights from last quarter as we see no signs of potential slowdowns in AI-spending and fiscal stimulus, which continue to fuel US equity markets. While inflation and employment data remain a concern, we believe the current backdrop supports cash-generative equities tied to AI spend and short to mid-duration high-carry credit over long-duration government paper.
Figure 1: Tactical Income asset allocations
December 31, 2022 – September 30, 2025
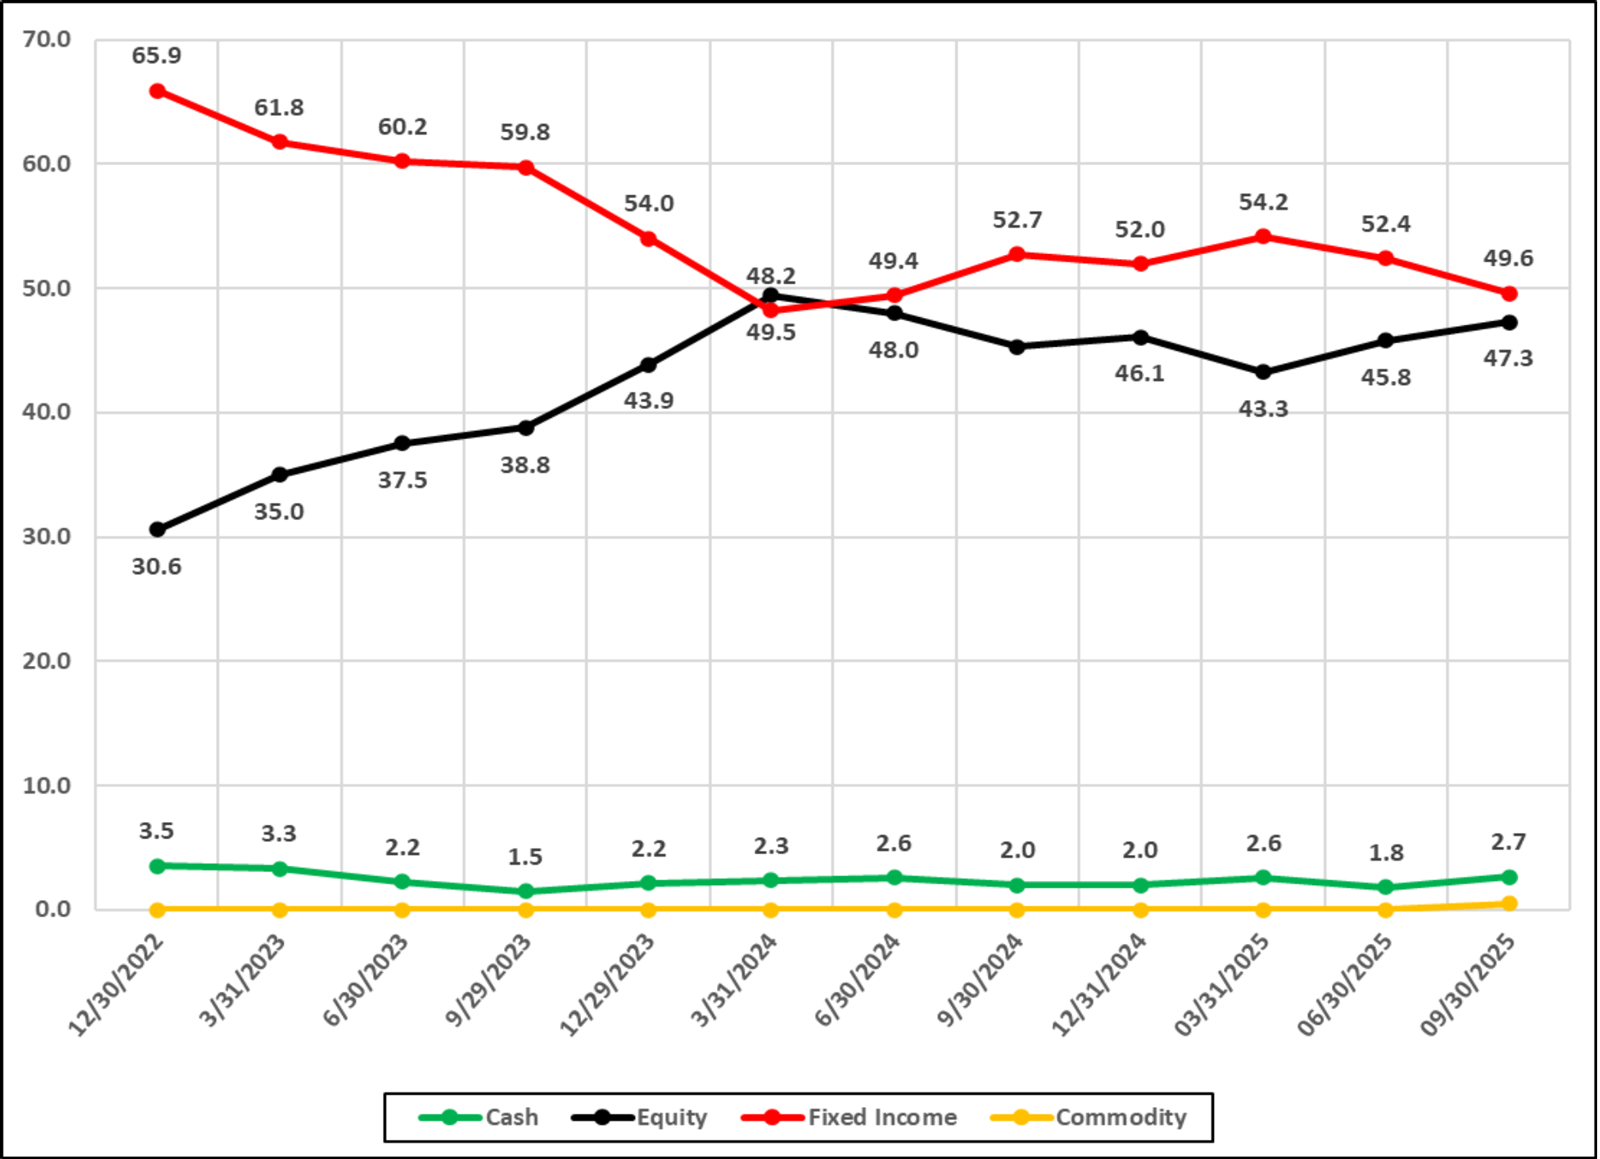
Figure 1: Tactical Income asset allocations
Source: Bloomberg & INDATA, As of 9/30/25
The following specific asset adjustments were made to the portfolio during the quarter.
1. Quality Rotation and Profit-Taking (July–August)
- Trimmed AHR, TRI, RSG, and TSCO following multiple expansion that left limited upside relative to risk.
- Increased Cisco (CSCO) and initiated on Siemens AG (SIEGY), recognizing emerging AI tailwinds in networking, robotics, and security software.
- Exited Booz Allen Hamilton (BAH) as shares traded near fair value with rising risk that generative‑AI efficiencies compress federal consulting economics; we redeployed into higher‑conviction AI enablers and platform assets, notably Alphabet (GOOGL).
- Trimmed Apple (AAPL) given a ~28× FY26 adj. P/E versus a ~23× peer set, slower multi‑year growth, and onshoring/supply‑chain margin risks; proceeds funded GOOGL.
- Exited Accenture (ACN) amid mounting AI-driven disruption risk to its traditional consulting model, redeploying capital to TE Connectivity (TEL) and TSM, both positioned to benefit from AI infrastructure demand.
2. Repositioning Credit and Duration (July–August)
- Trimmed BKLN, SHYG, and JAAA to reduce floating rate exposure and to use as a source of funds ahead of potential rate cuts, reallocating to MBB and VCIT to modestly lengthen duration and improve portfolio quality.
- Increased Bank of America (BAC) and Wells Fargo (WFC) to benefit from expected curve steepening and deregulation; we see improved NII trajectory, operating leverage from cost programs, and attractive valuations (~1.2× and ~1.4× book, respectively; WFC ROE ~12%+).
- Trimmed Short-Term Treasuries (VGSH) in an effort to increase duration and fund new equity positions.
- These moves in fixed income raised the duration to roughly 2 years while maintaining a yield > 4%, positioning for a potential bull-steepening should growth soften further.
3. Late-Quarter Additions (September)
- Added Analog Devices (ADI) and Truist Financial (TFC) for cyclical exposure to U.S. reacceleration potential in 2026, both offering solid balance sheets and dividend support.
- Initiated a small sleeve in FT Vest Gold Strategy Target Income ETF (IGLD) as a yield-paying inflation hedge, diversifying rate and credit exposures.
- Incrementally added to VCIT once more in early September, bringing investment-grade corporates to a near 25% weight while reducing floating-rate exposure.
- Trimmed Vanguard FTSE Europe (VGK) as we rebalanced non‑U.S. exposure due to weak European macro data and funded higher‑conviction U.S. positions.
By quarter-end, the portfolio reflected a deliberate slight overweight equity exposure near 47.3% duration at 3.2 years, and a forward yield of 4.3%. These adjustments positioned the strategy for continued resilience through potential late-cycle volatility.
Figure 2: Tactical Income 3Q25 Sector Allocation Changes
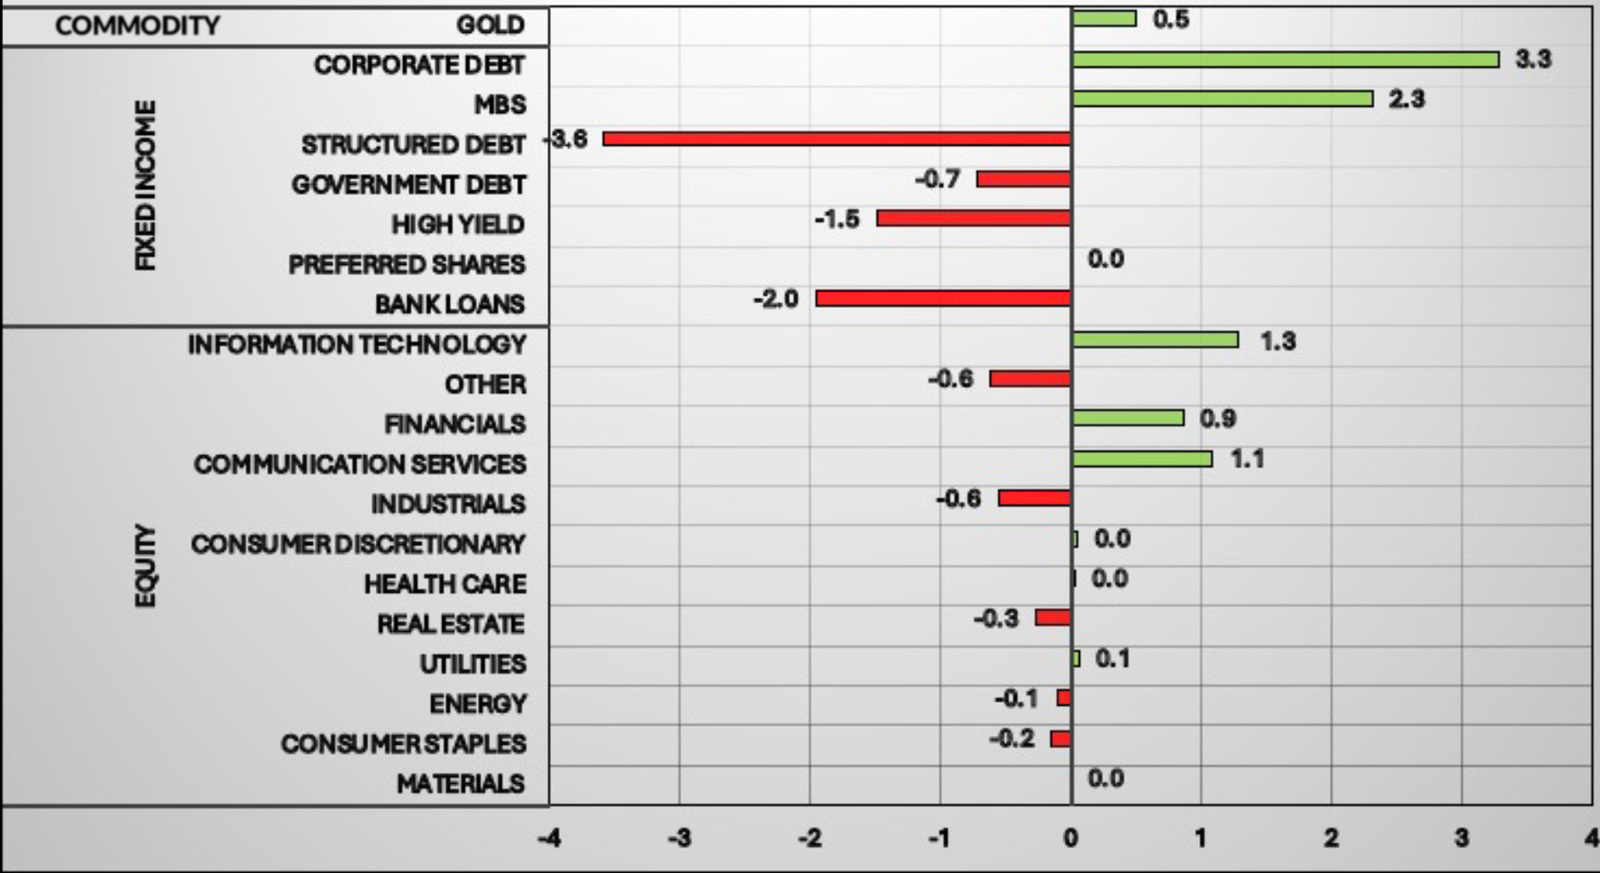
Figure 2: Tactical Income 3Q25 Sector Allocation Changes
Source: Bloomberg & INDATA, as of 9/30/25
Performance Drivers & Attribution
Composite (Gross): +3.89% vs. Benchmark*: 4.10% vs. Secondary Benchmark: 3.72%
Performance: The strategy produced a positive total return for the quarter, supported by income carry and selective equity strength, though it modestly trailed the benchmark* due to its underweight in high-duration technology, many of which we cannot own due to our yield and volatility mandate. As for our secondary bench, the Morningstar Moderately Conservative Index, we modestly beat the Index by 16bps for the second quarter, however, YTD we remain behind. As mentioned in last quarter’s letter, our secondary bench holds a significantly larger portion of non-US equities in both developed and emerging markets, which have outperformed US markets year to date.
Quick Snapshot of 3Q Attribution:
- Average Asset Allocation during 3Q25: 2.3% Cash, 46.5% Equity, 51.2% Fixed Income.
- Yield on the portfolio as of 9/30/2025 was 4.3% with the fixed income side of the portfolio at 5.30% yield to maturity.
- The Hilton Tactical Income Composite returned 3.89% net and modestly trailed the benchmark* return of +4.10% by 21 basis points.
- The equity sector contribution to return was 2.99%, which was 20bps behind the equity portion of the benchmark*. Notably detractors were from our underweight / non-ownership positions in information technology and consumer discretionary.
- JEPQ (+45bp), GOOGL (+37bps), ORCL (+22bp), TSM (+19bps) XLU (+16bps), TJX (+13bps), AZN (+10bps), JEPI (+9bps), TSCO (+8bps), VGK (+7bps), were key contributors to performance, with many benefiting from expanding AI infrastructure demand.
- Fixed Income holdings contributed +0.92% which was even with the fixed income portion of the benchmark due to our lower allocation weight.
- The average duration of the fixed income portfolio was 3.2 with an average credit rating of A.
Outlook
We continue to expect a slow-disinflation environment with elevated fiscal support and selective AI-driven CapEx strength. The Tactical Income portfolio remains positioned for balanced participation:
- Equities: Maintain a moderate overweight, emphasizing cash-returning AI enablers (CSCO, ORCL, IBM), financials (BAC, WFC, TFC), and energy infrastructure (WMB, AMLP) while avoiding richly valued growth extremes.
- Fixed Income: Retain short-to-intermediate duration (~3 - 3.5 years) and bias toward high-quality credit for income resilience due to spread compression.
- Income Profile: Portfolio yield remains around 3% with volatility below 6%, roughly one-third that of equities.
As we approach year-end, the strategy’s balance of quality income, selective equity risk, and tactical flexibility should allow us to capitalize on opportunities while maintaining our hallmark of steady compounding through uncertain macro conditions.
*Primary Benchmark = 40% SPX TR Index / 60% Bloomberg Intermediate US Govt/Credit TR Index Value Unhedged
Important Disclosures:
Hilton Capital Management, LLC (“HCM”) is a Registered Investment Advisor with the US Securities Exchange Commission. The firm only transacts business in states where it is properly notice-filed or is excluded or exempted from registration requirements. Registration as an investment advisor does not constitute an endorsement of the firm by securities regulators nor does it indicate that the advisor has attained a particular level of skill or ability.
The views expressed in this commentary are subject to change based on market and other conditions. The document contains certain statements that may be deemed forward looking statements. Please note that any such statements are not guarantees of any future performance and actual results or developments may differ materially from those projected. Any projections, market outlooks, or estimates are based upon certain assumptions and should not be construed as indicative of actual events that will occur.
All information has been obtained from sources believed to be reliable, but its accuracy is not guaranteed. Sources include: Bloomberg and INDATA (our portfolio accounting and performance system). There is no representation or warranty as to the current accuracy, reliability or completeness of, nor liability for, decisions based on such information and it should not be relied on as such.
The S&P 500 Total Return Index, often referred to as SPX TR, is a version of the S&P 500 index that includes both capital gains and dividends. Unlike the standard S&P 500 Price Return Index (SPX), which only reflects changes in stock prices, the SPTR reinvests dividends paid by the companies in the index, providing a more comprehensive measure of investment performance. We believe that this makes it a better benchmark for evaluating the actual returns an investor might receive.
The Bloomberg Intermediate US Government/Credit TR Index Value Unhedged Index is a broad-based benchmark that measures the non-securitized component of the Bloomberg US Aggregate Index with maturities less than 10 years. It includes: investment-grade, US dollar-denominated, fixed-rate Treasuries, government-related securities, and corporate bonds. The "Total Return (TR)" aspect means it includes interest income and price appreciation. "Unhedged" indicates that it does not use currency hedging, which is relevant for international investors.
The Morningstar Moderately Conservative Index represents a diversified portfolio of: global equities, bonds, and traditional inflation hedges such as commodities and TIPS (Treasury Inflation-Protected Securities). It is designed for U.S. investors seeking slightly below-average exposure to equity market risk and returns. The portfolio maintains a static allocation, typically targeting around 40% equity exposure, making it suitable for moderately conservative investment strategies.
The composite performance information contained herein is unaudited, was calculated by HCM and is shown on both a gross-of-fee and net-of-fee basis. The performance results herein include the reinvestment of dividends and/or other earnings, and the net-of-fee performance results are shown net of the actual advisory fees paid by the client accounts in the HCM Tactical Income Composite. In addition, actual client accounts may incur other transaction costs such as brokerage commissions, custodial costs and other expenses. Accordingly, actual client performance will differ, potentially materially, particularly given that the net compounded impact of the deduction of investment advisory fees over time will be affected by the amount of the fees, the time period, and the investment performance. For additional information about the composite, please contact us - info@hiltoncm.com
All investing involves risks including the possible loss of capital. Asset allocation and diversification does not ensure a profit or protect against loss. Please note that out- performance does not necessarily represent positive total returns for a period. There is no assurance that any investment strategy will be successful. All investments carry a certain degree of risk. Dividends are not guaranteed, and a company’s future ability to pay dividends may be limited.
Additional Important Disclosures may be found in the HCM Form ADV Part 2A, which can be found at https://adviserinfo.sec.gov/firm/summary/116357.