HCM Insights

As we bid farewell to 2023, we reflect on a year that presented an array of challenges and unexpected turns for the U.S. economy and financial markets. The past 12 months unfolded as a tumultuous journey, marked by a convergence of complex factors that tested the resilience of economic foundations.
Commencing the year amid concerns of elevated inflation and decelerating growth, coupled with widespread projections of an imminent recession, the economic landscape appeared daunting. The narrative further intensified with the onset of an earnings recession, a pronounced dip in the housing market, a fleeting banking crisis, and geopolitical unrest manifested through conflicts in both Europe and the Middle East. Against this backdrop, and amid escalating tensions in Asia, the prevailing sentiment suggested an uphill battle for both the economy and financial markets.
Despite significant headwinds, both the U.S. economy and the financial markets not only weathered the storm but demonstrated remarkable resilience. While the end results were quite impressive, 2023 was a volatile ride:
- Equity 2023 total returns: SPX 500 +26.3% Nasdaq +44.7% Russell +16.9%
- 6 different market rallies > 10%; including 3 > 15%
- 4 different market drawdowns > 10%; including 2 > 15%
- Challenging technicals—periods of constant overbought/oversold conditions
- VIX range 12.1-26.5; MOVE range 96.6-198.7; High Yield Spreads range 312-516
- The SPX recovered the entire -24.4% market drawdown from cycle highs on 1/1/2022
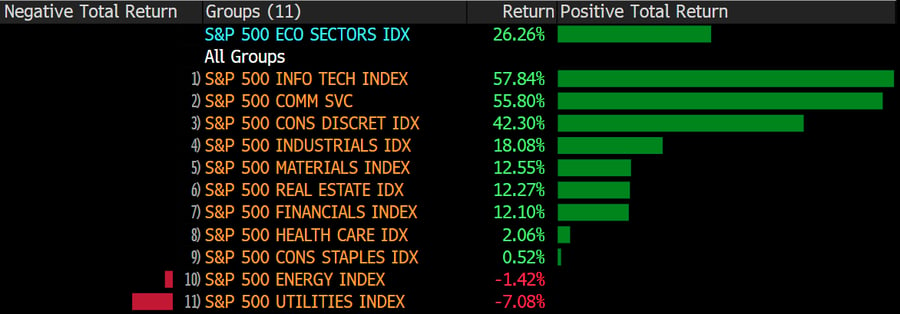
Figure 1: Full Year 2023 Sector Performance for S&P 500
Let’s not overlook the impact of the Magnificent 7, dominating headlines and significantly influencing returns throughout 2023:
- The Magnificent 7 now constitutes roughly 27.4% of the total market cap of S&P 500
- Total Return of the Mag 7 was 81.9% in 2023 vs 12.5% for the S&P 500 minus Mag 7 returns
- Over the year, the Magnificent 7’s contribution to the total return of S&P 500 was roughly 60%
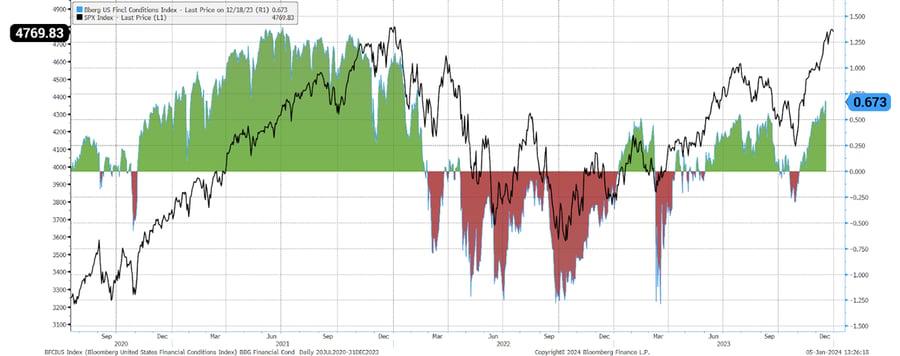
The macro economy figured prominently throughout 2023 and was a major factor in market volatility. Varying views on inflation, growth, and Federal Reserve policy boiled down to a tug-of-war between the Soft-Landing vs Hard-Landing narratives. Each economic data point was analyzed through this lens as investors struggled to determine where we were in the economic cycle and where the economy was heading. By the end of Q423, it appeared restrictive Federal Reserve policy, combined with easy Financial Conditions, resulted in lower inflation and a healthy level of economic growth, paving the way for the Soft-Landing narrative with risk assets surging.
A pivot on the Federal Reserve narrative to lowering rates created a strong “everything rally” that led markets higher into year end. The S&P 500 rallied +16% in Q4, the 7th best Q4 return since 1979. Both the S&P 500 and the Nasdaq were up for nine straight weeks to end 2023—a phenomenon that’s occurred only 12 times since 1960.
Figure 2: Easing Financial Conditions put a bid to risk assets into year end
As depicted in Figure 3 below, 2023 experienced several periods of elevated cross-asset volatility, placing considerable pressure on many investors. In navigating these turbulent periods, the pivotal strategy proved to be maintaining investment positions despite market fluctuations.
Figure 3: Cross Asset Volatility was elevated throughout 2023 but ended year at the lows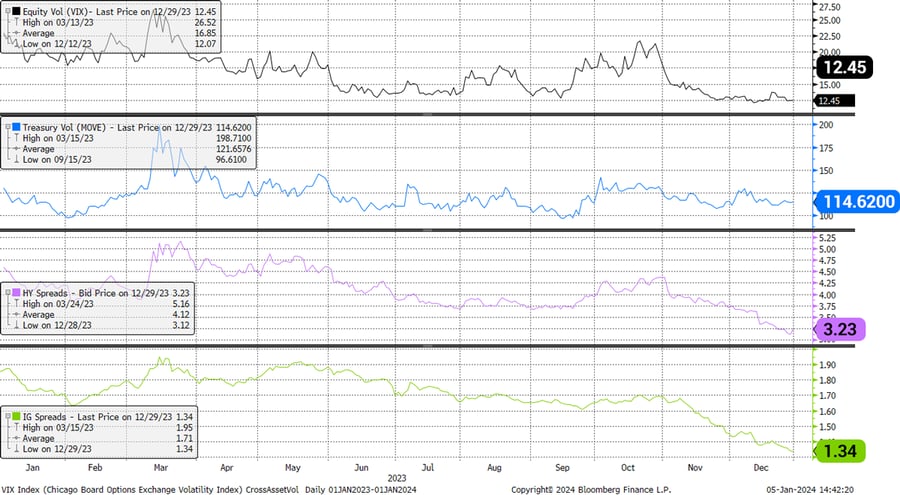
Tactical Income Strategy 2023 Review
The allocation process of Tactical Income is centered around identifying the current stage of the economic cycle and channeling risk toward the asset classes, sectors, and individual names poised to thrive from the projected macroeconomic currents. Yet, in the post-Covid landscape, the conventional economic cycle has seen a disruption, necessitating an adaptative stance from the Investment Committee.
Additionally, the Federal Reserve's actions are casting considerable influence over the potential duration and course of the cycle, demanding an elevated level of focus, patience, and versatility in risk positioning within the portfolio. We believe the macro-centric and tactical nature of our strategy will be advantageous in this peculiar macroeconomic setting.
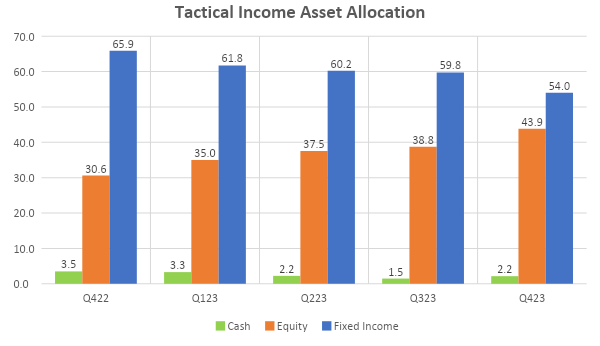
Throughout 2023, the Investment Committee gradually added more risk to the portfolio in response to the resurgence of certain economic indicators. Positive inflation data coupled with consistent economic growth instilled confidence in the viability of the Soft-Landing narrative. Consequently, the average equity exposure increased by over 13% during the year, with the beta-adjusted equity weighting experiencing a notable uptick of over 15%. This proactive approach reflects the committee's commitment to dynamic risk management in an ever-evolving economic environment.
Figure 4: TI Asset Allocation: risk added gradually throughout 2023
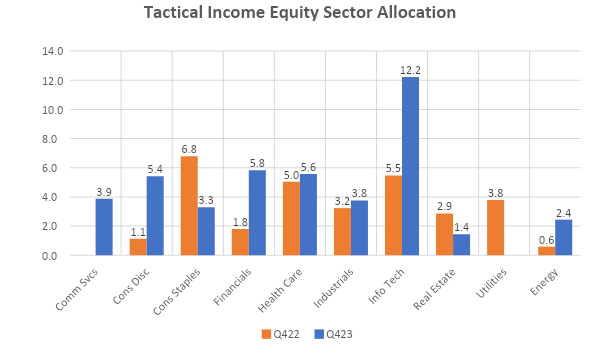
Not only was the equity allocation increased, but the sector allocations also represented an increase in overall market exposures. In general, the Investment Committee reduced defensive exposures and added to cyclical/growth to take advantage of macro tailwinds. The big YoY increases included Info Tech, Consumer Discretionary, and Communication Services.
Figure 5: Year End 2022 vs 2023 TI equity sector allocation
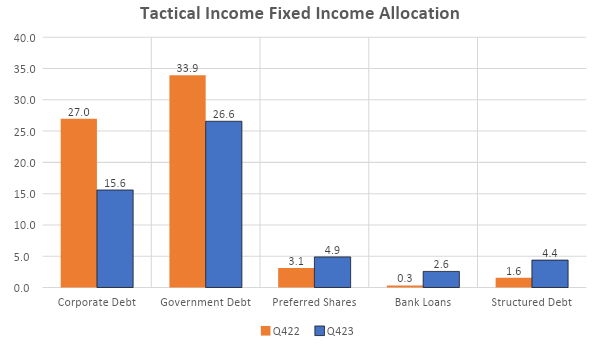
Treasury and Corporate Debt exposures were reduced in favor of equities and slight increase to credit exposures.
Figure 6: Year End 2022 vs 2023 TI fixed income allocations
In 2023, the Hilton Capital Tactical Income Strategy delivered commendable results, achieving returns of 8.16% gross and 7.62% net. These outcomes, when considered alongside the one-year standard deviation of 6.0%, resonate with our strategic commitment to maintaining an appealing risk/reward profile. Such alignment allowed our clients to stay invested throughout the year, insulated from the heightened volatility experienced in the broader market.
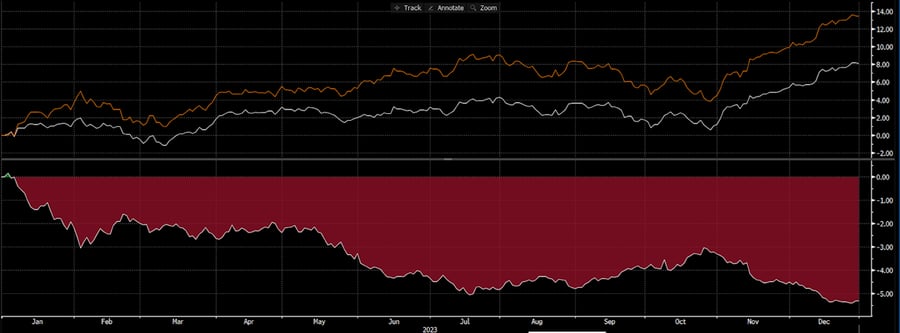
The Tactical Income Strategy did underperform its benchmark by 508bp gross and 563bp net. As Figure 7 illustrates, the underperformance was consistent throughout 2023 and can be attributed to two primary factors: 1) defensive positioning coming into 2023 and 2) the lag associated with the inability to invest in the majority of the Magnificent 7.
Figure 7: Absolute & Relative Performance vs Benchmark for Full Year 2023
As Figure 8 shows, 333bp of the benchmark return is associated with individual names (Magnificent 7) that significantly outperformed the S&P 500 and cannot be owned by the strategy given they do not pay a dividend.
Figure 8: Magnificent 7 (ex dividend payers) contribution to Benchmark return
| Avg % Wgt | Contribution to Return (%) | |||||
| Port | Bench | +/- | Port | Bench | +/- | |
| NVIDIA CORP | 0.99 | -0.99 | 1.06 | -1.10 | ||
| AMAZON.COM INC | 1.20 | -1.20 | 0.74 | -0.77 | ||
| META PLATFORMS INC-CLASS A | 0.64 | -0.64 | 0.63 | -0.66 | ||
| TESLA INC | 0.65 | -0.65 | 0.41 | -0.42 | ||
| ALPHABET INC-CL A | 0.78 | -0.78 | 0.37 | -0.38 | ||
| Total | -3.33 | |||||
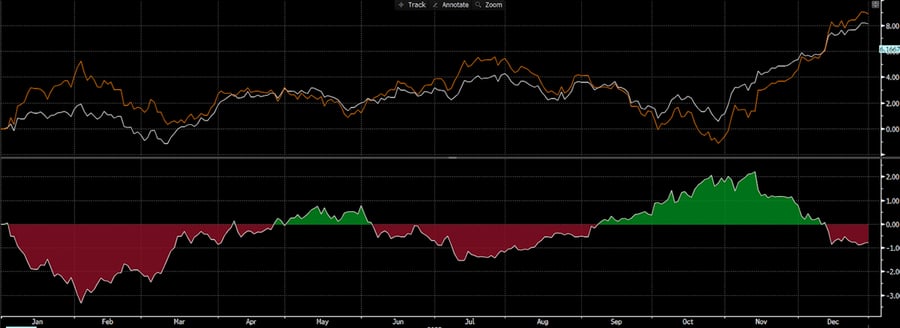
For illustrative purposes, Figure 9 provides a comparative analysis of the Tactical Income Portfolio against a hypothetical benchmark incorporating the S&P 500 Equal Weight, rather than the traditional S&P 500. This adjustment serves to “right size” the influence of the Magnificent 7 on the benchmark returns. The S&P 500 Equal Weight boasted a total return of 13.8% vs the S&P 500 return of 26.3%. The Tactical Income portfolio underperformed this revised benchmark by -78bp, again illustrating how much the Magnificent 7 impacted market returns. It is also worth noting that the Equity return for the Tactical Income Strategy mirrored that of the S&P 500 Equal Weight at 13.8%.
Figure 9: Absolute & Relative Performance vs Benchmark Using S&P Equal Weight for Full Year 2023
As discussed, the Tactical Income Strategy faced a challenging yet dynamic landscape in 2023, navigating through a disrupted economic cycle and the influential shifts brought about by post-Covid uncertainties. The Hilton Investment Committee demonstrated adaptability and a commitment to its macro-centric and tactical approach, recognizing the impact of Federal Reserve actions on the economy and the markets.
Throughout the year, the Committee strategically adjusted risk, steadily increasing equity exposure and aligning with a growing confidence in the Soft-Landing narrative. Cautious optimism throughout 2023 empowered the Committee to maintain exposure to the markets and weather much of the volatility. This produced a solid risk/reward outcome for the strategy.
As we look ahead, the Committee anticipates that the Federal Reserve will pivot from its restrictive policy stance, which should provide a solid backdrop for risk assets. However, market technicals and high valuations, along with conflicting economic data and geopolitical risks, will continue to create a volatile backdrop. As always, we will monitor the economic data to make the tactical moves necessary to navigate this dynamic economic cycle.
All information set forth herein is as of December 31, 2023, unless otherwise noted. This email contains general information that is not suitable for everyone. The information contained herein should not be construed as personalized investment advice. There is no guarantee that the views and opinions expressed in this email will come to pass. Investing in the stock market involves gains and losses and may not be suitable for all investors. Information presented herein is subject to change without notice and should not be considered as a solicitation to buy or sell any security. Hilton Capital Management, LLC (“HCM”) is a registered investment adviser with its principal place of business in the State of New York. For additional information about HCM, including fees and services, send for our Form ADV using the contact information herein. Please read the Form ADV carefully before you invest or send money. Past performance is no guarantee of future results. All information set forth in this email is estimated and unaudited.
*Tactical Income Benchmark = 40% SPX TR Index / 60% Bloomberg Intermediate US Govt/Credit TR Index Value Unhedged. Please see the Tactical Income Presentation which contains full performance information as well as relevant legal and regulatory disclaimers.