HCM Insights

This quarter’s title is a nod to the Stones’ “Dancin’ with Mr. D” from their 1973 release Goat’s Head Soup. The song chronicles a daring soul engaged in a dance with Mr. D, aka death. We would not dream of comparing the current Mr. D(onald J. Trump) with death (!), so we swapped in “V” for volatility. The avalanche of new policies, their real effects and the noise they created, along with sundry other developments, made for an eventful market year, generated more than a little angst, and required adjustments along the way. In hindsight, the economy and markets successfully danced with Mr. V, with most major indexes posting positive returns. Now, the tariff and monetary bugaboos of 2025 have faded, though not disappeared, and have been joined by the specter of increased government intervention across numerous markets. This may prove to be bluster or “negotiating tactics,” but it looks like the dance with Mr. V will continue. Dance on.
Fourth Quarter 2025 Review
Stocks traded mostly sideways early in the fourth quarter before selling off in November on fears that we had seen the last of rate cuts. Once it became clear that additional cuts were still on the table, markets recovered and bounced around, finishing the quarter slightly higher. The SMCO composite’s modest fourth quarter gain of +0.59% gross/+0.45% net was outpaced by the Russell 2500’s +2.22%.
Within the portfolio, we saw strong gains from our Technology, Energy, and Materials holdings, but these were largely offset by weakness in Staples, Communication Services, and Real Estate. From a broader market perspective, lower-quality stocks continued to appreciate sharply, and the biotech sector extended its rally, with biotech alone contributing more than half of the index’s quarterly gain. You are probably tired of hearing about the “low-quality rally,” and frankly we are tired of talking about it, but it accurately describes market action in the fourth quarter and for much of 2025.
We had some stock-specific drags during the quarter, but once again our relative lag was largely a function of the complexion of the market’s advance. Encouragingly, small- and mid-cap stocks only slightly trailed their large-cap counterparts in the fourth quarter and outperformed during the second half of the year. Broadening investor interest finally reached the small- and mid-cap space, which we believe is constructive for SMCO as we move into 2026.
SMCO Annual Review 2025
| Composite YTD Return | +7.21% gross/+6.65% net. |
| Turnover | 26.30% |
| Biggest Contributors by Sector | Industrials, Technology, Utilities |
| Five Biggest Contributors by Stock | Ciena, Dycom, Primoris, BWXT Technology, nVent Electric |
| Biggest Detractors by Sector | Staples, Real Estate, Healthcare |
| Five Biggest Detractors by Stock: | Primo Brands, elf Beauty, Americold, Tenable, Simply Good Foods |
| New Names: | RadNet, Shift4 Payments, YETI, Academy Sports, HealthEquity, Taylor Morrison Home, TETRA Technologies, Lumen, Federal Signal |
| Names Eliminated | Amentum, Ares, Teleflex, ICF International, elf Beauty, Charles River Labs, Helmerich & Payne, Broadridge, Simply Good Foods, Americold Realty, Alexandria Real Estate |
| Holdings At Beginning of Year | 64 |
| Holdings At Year-End | 62 |
Zooming out, 2025 was a positive year overall, with tariff and policy uncertainty driving a first-half pullback and the aforementioned rate concerns leading to a shallower dip in the back half. The net result was a profitable year for smid-cap stocks, with the Russell 2500 finishing up +11.91%. The SMCO composite posted more modest gains, returning +7.21% gross/+6.65% net, as lower-quality and more speculative stocks surged, outpacing our strategy as well as many of the active managers in the space. Cohorts such as meme stocks, unprofitable technology companies, and my personal favorite, heavily shorted stocks, all markedly outperformed, as shown below.
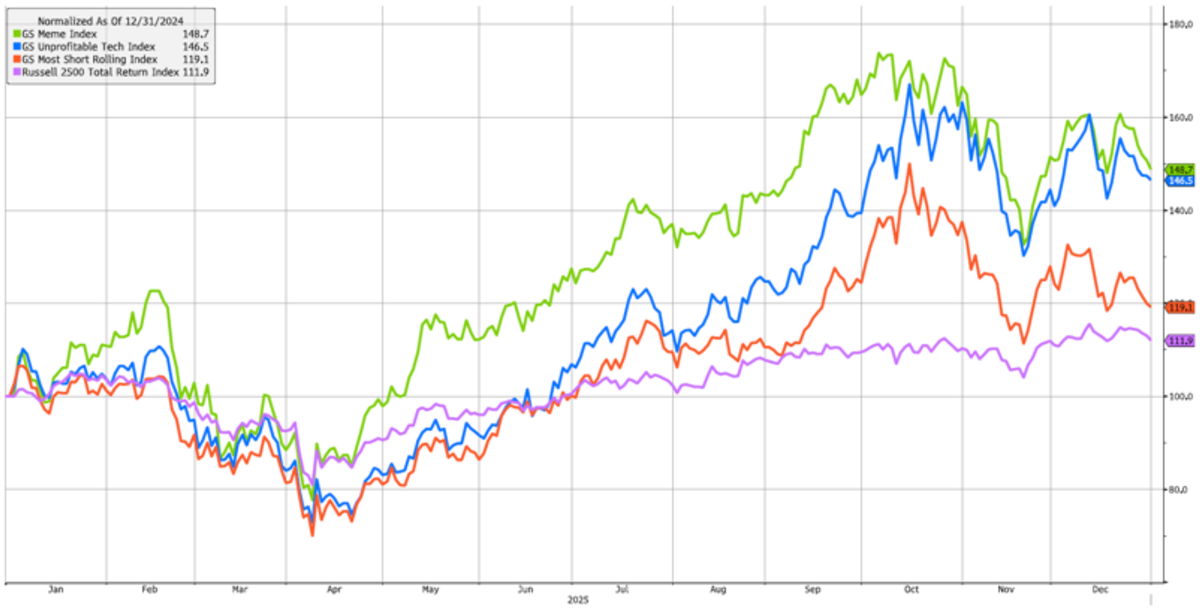
Source: Bloomberg. As of 12/31/25.
It is not unprecedented for these types of stocks to dominate the early phases of a small- and mid-cap cycle, but we believe the magnitude of the performance gap over such a compressed time period was striking. Shown below is the relative performance of the UBS Low Quality Index versus the High Quality Index.
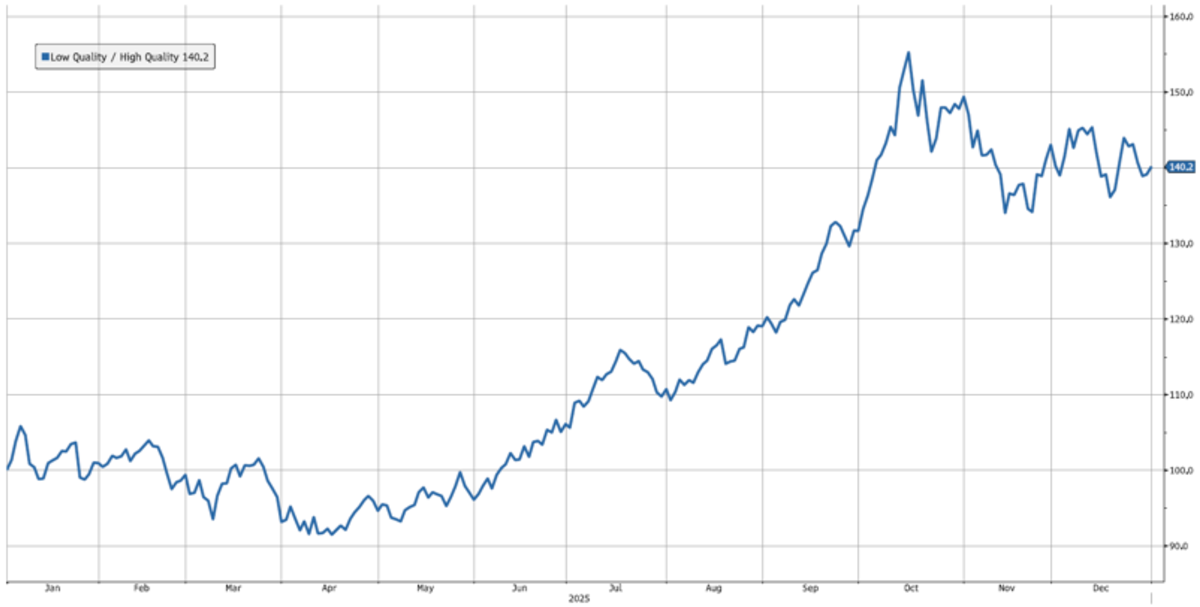
Source: Bloomberg. As of 12/31/25.
Our decision not to turn defensive early in the year, along with several adjustments we made as conditions evolved, helped us remain competitive. We selectively increased risk and added to areas such as beaten-down consumer names, funding those purchases with sales of fundamental disappointments and trims to positions that had performed well. These changes were designed to allow us to participate in the market at hand. That said, adapting to market conditions does not mean throwing out our playbook.
Our strongly held conviction is that better companies tend to be better investments over time, which in our view argues against a wholesale move down the quality curve. In our experience, low-quality stocks can post impressive gains, but when those gains are not grounded in fundamentals, they can prove fleeting. To borrow a line from Jimi Hendrix, “castles made of sand… wash into the sea, eventually.” We are always cognizant of the benchmark and our peer group, but our overriding focus is on generating attractive, risk-adjusted returns over a full market cycle. A durable, repeatable process is central to that pursuit.
Our ability to identify several beneficiaries of AI-related spending, the topic du jour, contributed meaningfully to the portfolio’s returns. We remain exposed to the theme, but have managed that exposure thoughtfully. We continue to see opportunity here, though expectations are elevated and valuations are stretched, which can make pullbacks sharp and sudden.
Taken together, we believe 2025 reinforced the importance of discipline, flexibility, and process. While speculative leadership created headwinds for quality-oriented strategies like ours, we remain confident that our approach is well suited for full market cycles rather than short-lived bursts of enthusiasm. We exit the year with a portfolio we like, exposure to long-term secular tailwinds, and a growing set of company-specific opportunities that we believe position us well for what lies ahead.
“Ride On” or “Shelter from the Storm”: 2026 Outlook
In some ways, conditions entering 2026 are reminiscent of early 2025. A mix of conflicting policy initiatives, some pro-business and others strikingly anti-business, gives investors plenty to digest.
| Pro-Business Policies | Anti-Business Policies |
| Tax cuts on the way | 10% Credit Card Interest Rate Cap |
| Large defense spending proposals | Punitive tariff threats |
| Regulatory rollback | Prohibition on corporate purchases of single-family homes |
| Cost-lowering energy policy | Attempts to dictate corporate capital spending, dividend policy and compensation at private companies |
| Support & funding for infrastructure spending | |
| “Not QE” QE aimed at lowering rates |
Last year’s positive outcome was powered by solid macro growth, improving corporate earnings, moderating inflation, and slightly softer employment data that created room for rate cuts. Early 2026 data appear broadly consistent with that backdrop, and unless “Mr. V” kicks up meaningfully, we believe the setup remains constructive. As always, however, the path forward is shaped by both known unknowns and unknown unknowns:
| Known Unknowns | Unknown Unknowns |
| Erratic and shifting government policy | Multiple geopolitical hotspots |
| An unusual low-hire, low-fire labor market | Dollar debasement concerns |
| Tensions between the Fed and the White House | A return of old-school cyclicality |
| AI funding anxiety | AI’s longer-term impact on labor |
| A K-shaped economy | |
| Still-persistent inflation | |
| A more stringent immigration posture | |
| Midterm elections |
We see both macro and micro catalysts that we believe could support small- and mid-cap stocks going forward. At the macro level, AI’s continued buildout has the potential to drive meaningful revenue opportunities for companies in our segment of the market. We also expect that spending to broaden, with increasing focus on areas such as data networking, power generation, and the buildout of transmission infrastructure.
Beyond AI, the core industrial economy has endured a long winter and may be primed for improvement. Purchasing Managers’ Indices (“PMIs”), particularly in manufacturing, have been below 50 for much of the period since 2023, and more recent data suggest activity could be stabilizing. Finally, areas such as consumer and healthcare have been largely overshadowed by the market’s intense focus on technology and AI. In select pockets, we see a combination of compressed valuations and improving fundamentals, which in our view creates opportunity.
At the micro level, many small- and mid-cap companies have begun to show signs of margin expansion. While we believe AI adoption could further enhance efficiency over time, much of what we have seen so far appears to reflect the efforts of stronger management teams navigating inflation and tariffs. Companies have been forced to sharpen execution, improve and diversify their supply chains, and adopt more proactive pricing strategies. If sustained, these efficiency and productivity gains could act as a multiplier on revenue growth, supporting higher earnings. At the same time, proposed anti-business policies introduce a layer of uncertainty. For now, positive growth dynamics and pro-business initiatives appear to be winning out, but the potential drag from less constructive policies remains just beneath the surface.
Numerous false starts have kept investors from fully embracing the small- and mid-cap space, but once again the setup appears attractive. The outperformance of smid stocks during the second half of 2025 suggests that interest may be strengthening. Mega-cap “exhaustion” could be part of the story, but relative earnings growth expectations may also be playing a role. Consensus projections call for earnings growth of approximately +17% for the Russell 2500 in 2026 and +22% in 2027, which compares favorably to the +11% and +15% expected for the S&P 500, respectively (source: Bloomberg).
To close, we offer two possible soundtracks for the year ahead, from very different artists. The first is AC/DC’s “Ride On” from their 1976 album Dirty Deeds Done Dirt Cheap. The song reflects the mindset of a rock-and-roll singer who has to “ride on” regardless of what the road may bring. Less raucous than typical AC/DC fare, its steady, plodding beat hints at the simmering anxiety that investors may feel in an increasingly chaotic world.
The second possible soundtrack comes courtesy of Mr. Zimmerman, better known as Bob Dylan. “Shelter from the Storm” was the penultimate track on his 1974 classic Blood on the Tracks. As outlined above, markets face no shortage of challenges in 2026. While the underlying positives are numerous, if the swirl of negatives becomes overwhelming, many investors may find themselves searching for “shelter from the storm.”
At this point, we believe the positives outweigh the negatives, and the market’s recent ability to cut through the noise keeps us firmly in the “Ride On” camp. Still, as always, we remain vigilant and will adjust as conditions evolve.
Thank you for your continued interest and support.
Important Disclosures:
Hilton Capital Management, LLC (“HCM”) is a Registered Investment Advisor with the US Securities Exchange Commission. The firm only transacts business in states where it is properly notice-filed or is excluded or exempted from registration requirements. Registration as an investment advisor does not constitute an endorsement of the firm by securities regulators nor does it indicate that the advisor has attained a particular level of skill or ability.
The views expressed in this commentary are subject to change based on market and other conditions. The document contains certain statements that may be deemed forward looking statements. Please note that any such statements are not guarantees of any future performance and actual results or developments may differ materially from those projected. Any projections, market outlooks, or estimates are based upon certain assumptions and should not be construed as indicative of actual events that will occur.
All information has been obtained from sources believed to be reliable, but its accuracy is not guaranteed. Sources include: Bloomberg and INDATA (our portfolio accounting and performance system). There is no representation or warranty as to the current accuracy, reliability or completeness of, nor liability for, decisions based on such information and it should not be relied on as such.
The performance information contained herein is unaudited, was calculated by HCM and is shown on both a gross-of-fee and net-of-fee basis. The performance results herein include the reinvestment of dividends and/or other earnings, and the net-of-fee performance results are shown net of the actual advisory fees paid by the client accounts in the HCM SMID Cap Composite. In addition, actual client accounts may incur other transaction costs such as brokerage commissions, custodial costs and other expenses. Accordingly, actual client performance will differ, potentially materially, particularly given that the net compounded impact of the deduction of investment advisory fees over time will be affected by the amount of the fees, the time period, and the investment performance. For additional information about the composite, please contact us - info@hiltoncm.com
All investing involves risks including the possible loss of capital. Asset allocation and diversification does not ensure a profit or protect against loss. Please note that out- performance does not necessarily represent positive total returns for a period. There is no assurance that any investment strategy will be successful. All investments carry a certain degree of risk. Dividends are not guaranteed, and a company’s future ability to pay dividends may be limited.
Additional Important Disclosures may be found in the HCM Form ADV Part 2A, which can be found at https://adviserinfo.sec.gov/firm/summary/116357.