HCM Insights

The fourth quarter of 2025 marked a constructive conclusion to a year defined by unusually narrow equity leadership, elevated macro uncertainty, and a persistent tension between income generation and risk control. While markets once again rewarded a small group of long-duration, non-dividend growth equities into year-end, the Hilton Tactical Income Strategy delivered steady absolute returns, preserved capital through multiple volatility regimes, and maintained a consistent income profile aligned with our mandate.
Importantly, the portfolio ended the year with a yield of approximately 4.4%, meaningfully above the year-end yield on the 10-year U.S. Treasury of 4.16%. We view this as a particularly relevant outcome given the strategy’s diversified income sources, modest duration exposure, and significantly lower volatility profile than both equities and long-duration bonds. In a year where income-oriented investors were often forced to choose between yield and risk, Tactical Income was able to deliver an attractive cash yield without relying on excessive duration or speculative equity exposure.
In addition, while the strategy modestly underperformed its blended benchmark for the year, Tactical Income meaningfully outperformed many 100% equity dividend-focused strategies1, despite ending the year with only ~46% equity exposure and approximately 50% allocated to fixed income. This relative outcome underscores the benefits of a balanced, multi-asset approach, delivering competitive total returns, more income than Treasuries2, and materially lower volatility than equity-only income products.
Macro & Market Landscape
The fourth quarter reinforced a market regime defined by higher-for-longer nominal rates, moderating real growth, and increasingly concentrated equity leadership, even as cross-asset volatility continued to compress.
Inflation & Rates.
Core PCE remained elevated near 2.8% year-over-year, still above the Fed’s target. Treasury yields rose earlier in the year amid fiscal concerns and heavy supply, but retraced meaningfully into year-end as growth data softened. The 10-year Treasury peaked near 4.5% before finishing the year around 4.2%, while the curve modestly steepened as markets began pricing multiple rate cuts in 2026 rather than further tightening. Despite this rally, real rates remained elevated, constraining long-duration assets.
Fiscal & Liquidity Backdrop.
Federal deficits remained large, with industrial policy, infrastructure, and energy-transition spending offsetting modest tariff-related revenue gains. Ongoing Treasury issuance continued to pressure the long end of the curve for much of the year, reinforcing a higher term-premium environment even as financial conditions eased. Cross-asset volatility declined steadily: the MOVE Index fell into the low-60s by year-end, equity volatility remained subdued, and FX volatility trended lower, supporting risk assets while masking underlying dispersion.
Equities & AI CapEx.
Equity performance was once again driven by a narrow cohort of AI-linked mega-caps, with NVDA, MSFT, and GOOGL contributing disproportionately to index returns, while value and dividend-oriented segments lagged. Importantly, this leadership continues to be underpinned by accelerating AI-related capital spending, rather than purely multiple expansion. Global AI CapEx is estimated to have exceeded $500 billion in 2025, with projections moving north of $700 billion in 2026, driven by hyperscaler data-center buildouts, power infrastructure, and semiconductor capacity. While this spending remains a powerful secular tailwind, it has also contributed to return concentration and increased sensitivity to funding costs and balance-sheet quality.
Credit & Growth Signals.
Credit spreads remained tight, with high-yield spreads near ~2.4% and investment-grade spreads close to cycle lows, supported by strong demand for income and limited net issuance. Late in the year, investor preference shifted modestly toward intermediate-duration IG credit over loans and lower-quality structures. Labor markets cooled gradually, with unemployment drifting toward ~4.6% and jobless claims stabilizing at higher levels, signaling slower but still positive growth.
4Q25 Performance Overview:
During the fourth quarter, the Tactical Income Strategy generated a positive absolute return and broadly kept pace with its blended benchmark. Relative performance for the quarter was driven primarily by equity selection rather than asset allocation, as the market continued to favor high-beta, long-duration growth stocks late into the year. With this, the Tactical Income Composite outperformed with a total return of 1.91% gross / 1.77% net versus 1.78% for the benchmark* during the fourth quarter. Throughout the quarter, portfolio volatility remained well contained and consistent with our long-term target of approximately 6% standard deviation.
We believe this risk discipline remains a defining feature of the strategy, particularly during periods where equity returns are increasingly concentrated in a narrow subset of the market.
Full-Year Context: Explaining Relative Performance:
For full-year 2025, relative underperformance versus the blended benchmark can be largely attributed to one dominant factor: our structural underweight to a small group of non-yielding, high-volatility mega-cap equities that drove a disproportionate share of index returns.
Specifically, the absence or under-ownership of the following names accounted for the majority of the year’s relative performance drag:
- Nvidia (-90 bps)
- Broadcom (-44 bps)
- Palantir (-14 bps)
- Tesla (-8 bps)
- Amazon (-8 bps)
- Micron (-9 bps)
- AMD (-7 bps)
- Berkshire Hathaway (-8 bps)
We think that these companies share two characteristics that conflict directly with our mandate: minimal or no yield, and volatility profiles that are inconsistent with our portfolio-level risk target. While Broadcom does pay a dividend, its ~1% weight in our blended benchmark would require a position size that materially increases volatility for a relatively modest income contribution.
We view this shortfall not as a breakdown in process, but as the explicit opportunity cost of mandate discipline in a year where equity leadership was unusually narrow and duration-sensitive.
2025 Composite (Gross): 9.6% (Net 9.0%) vs. Benchmark*: 11.4% vs. Secondary Benchmark 12.9%
Secondary Detractors: Alternative Asset Managers
Beyond the mega-cap AI complex, we also experienced modest performance drag from selective exposure to alternative asset managers, most notably Blue Owl (-22 bps) and Apollo (-11 bps). These positions were impacted by rising concerns around private credit, increased scrutiny of AI-linked infrastructure financing, and short interest against the broader AI trade.
In response, we proactively reduced exposure throughout the second half of the year, exiting OWL entirely and trimming APO on strength. While we remain constructive on private markets over the long term, we believe the marginal risk-reward became less attractive as funding costs rose and capital markets began to more aggressively price cycle risk.
4Q25 Portfolio Actions and Positioning:
Portfolio activity during the fourth quarter reflected a deliberate effort to reduce AI-thematic concentration risk, rotate toward higher-quality and more defensive income streams, and re-balance equity exposure toward areas with clearer cash-flow visibility. As the year progressed, we increasingly prioritized balance-sheet quality, funding durability, and downside resilience, particularly as market leadership became more narrowly concentrated in capital-intensive AI infrastructure beneficiaries.
Figure 1: Tactical Income Asset Allocations
January 1st, 2023 – December 31st, 2025
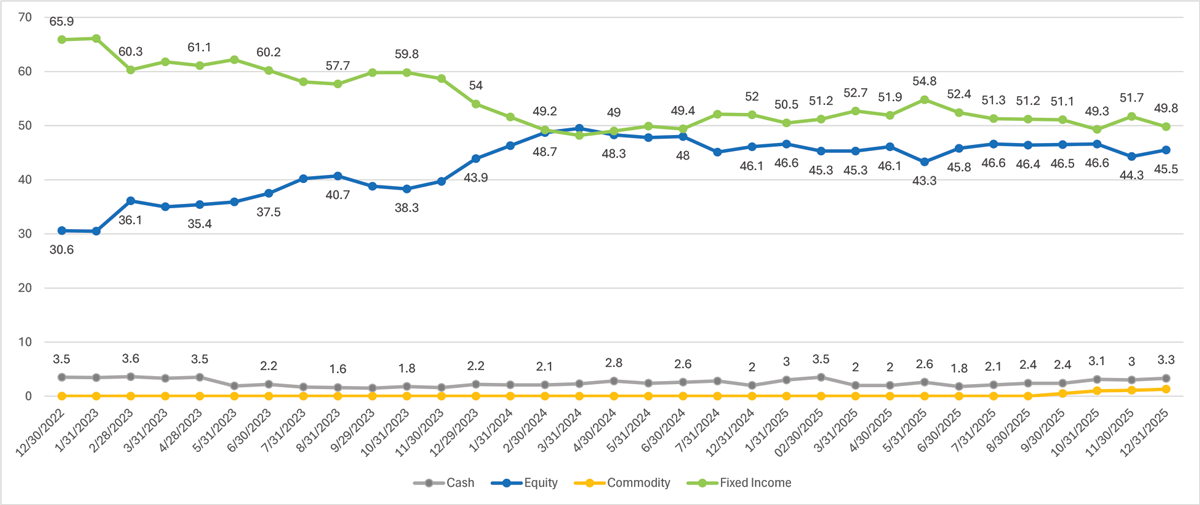
Figure 1: Tactical Income Asset Allocations
Source: Bloomberg as of 12/31/25
The trades listed herein encompass all transactions executed under the strategy during the fourth quarter (October 1 – December 31). This update is intended to offer a complete and transparent reflection of trading activity for fourth quarter of 2025.
1. Early-Quarter Rotation: Industrials, Energy, and Diversification (October)
We began the quarter by rotating out of select valuation-stretched or macro-sensitive positions and reallocating toward cyclically resilient industrials, energy infrastructure, and diversifying income assets.
- Exited Thomson Reuters (TRI) as the stock continued to trade at a premium (~35× earnings) despite growing investor skepticism around its AI positioning. With sentiment increasingly viewing TRI as an AI laggard, we saw asymmetric downside risk should growth expectations normalize.
- Exited Independence Realty Trust (IRT) amid a broader slowdown in U.S. housing activity, driven by lower household mobility, weaker job growth, and tightening immigration trends. While fundamentals remained stable, we saw better risk-adjusted opportunities elsewhere.
- Initiated Caterpillar (CAT) to re-establish traditional industrial exposure while participating in AI-driven power and infrastructure demand. CAT’s Energy & Transportation backlog, growing services mix, and data-center-related power demand provide a compelling blend of cyclical troughing and secular upside.
- Initiated EQT, the leading U.S. natural gas producer, reflecting our constructive view on gas demand tied to data-center power needs and LNG export growth. EQT’s balance-sheet de-leveraging and disciplined capital returns align well with our income and quality bias.
- Increased IGLD, our gold option-income position, to further diversify income sources. Gold remains one of the few liquid assets with low correlation to both duration and credit spreads, offering inflation and geopolitical hedging while maintaining distributable yield.
- Trimmed VGK as part of an ongoing reduction in European macro exposure, particularly given slowing growth in Germany and renewed tariff uncertainty.
2. Mid-Quarter Adjustments: Healthcare, REITs, and Equity Risk Management (October – November)
As equity markets continued to reward a narrow set of AI-linked names, we focused on defensive growth, position sizing discipline, and sector-level rebalancing.
- Exited Tractor Supply (TSCO) following valuation expansion despite low-single-digit organic growth and meaningful China supply-chain exposure. Proceeds were redeployed into healthcare.
- Initiated Abbott Laboratories (ABT) to add diversified healthcare exposure with durable growth drivers in Medical Devices and Diagnostics, anchored by FreeStyle Libre and a strengthening Structural Heart pipeline.
- Reduced AvalonBay (AVB) amid softening demographic trends and elevated rate pressure on apartment REITs, reallocating capital to Prologis (PLD), where industrial fundamentals appear to be bottoming and data-center power availability represents a multi-year growth catalyst.
- Trimmed Alphabet (GOOGL) multiple times throughout the quarter to manage single-name risk following a strong run and valuation expansion toward cycle-high multiples.
- Rotated JEPI into GPIX, reflecting a shift toward a more offensive covered-call strategy. While JEPI continues to provide stable income, GPIX offers higher upside participation with comparable yield and lower fees, better aligning the portfolio with our constructive near-term macro outlook.
3. De-Risking AI Infrastructure & Alternatives (November)
As scrutiny increased around the funding sources and economics of large-scale AI infrastructure projects, we took decisive steps to reduce exposure to capital-intensive, long-duration AI trades and alternative asset managers with concentrated thematic risk.
- Exited Oracle (ORCL) due to deteriorating balance-sheet quality and widening CDS spreads, reflecting rising leverage tied to long-dated AI-related RPO commitments. With limited internal AI monetization and dependence on third-party LLM success, we viewed ORCL as increasingly exposed to funding-cycle risk.
- Trimmed TSM to manage exposure to rising financing costs across the semiconductor value chain, while remaining constructive on its long-term technology leadership.
- Exited TE Connectivity (TEL) after meaningful multiple expansion, realizing gains while reducing cyclical and hyperscaler CapEx sensitivity.
- Exited Blue Owl (OWL) amid growing concerns around AI-linked data-center financing exposure and heightened scrutiny of private-credit underwriting quality.
- Increased VCIT materially, reallocating proceeds into intermediate-duration investment-grade corporates as a higher-quality ballast against equity and AI-thematic volatility.
- Sold VGK to reduce European macro exposure, particularly given slowing growth in France and Germany.
- Initiated on United Healthcare (UNH) to increase the portfolio’s defensive balance. Moreover, healthcare at large as been materially under owned for the last two years, therefore, we took advantage of cheap multiples in the space.
4. Late-Quarter Defensive Additions & Financials Rotation (December)
Late in the quarter, we leaned further into defensive growth, non-AI cyclicals, and income durability, while modestly increasing equity exposure into 2026.
- Initiated Johnson & Johnson (JNJ) to add high-quality, diversified healthcare exposure with strong free cash flow, modest leverage, and well-bounded litigation risk.
- Added Merck (MRK) following pipeline-enhancing M&A and an improving probability-adjusted outlook post-Keytruda LOE, at an undemanding valuation.
- Trimmed ARES and APO on strength to reduce concentration in alternative asset managers amid rising capital costs and AI-linked infrastructure exposure.
- Increased Bank of America (BAC) and Wells Fargo (WFC) to gain exposure to easing monetary policy, improving loan growth, and normalized credit formation—providing non-AI cyclical upside.
- Initiated WELL, reflecting strong conviction in the structural supply-demand imbalance in U.S. senior housing, with durable NOI growth and a conservative balance sheet.
- Exited NetApp (NTAP) due to strategic fragmentation and persistent underperformance within the AI storage ecosystem, reallocating capital to Accenture (ACN) following a valuation reset and improving free-cash-flow profile.
- Further increased GPIX and IGLD, lifting equity participation and income diversification while using VGSH as a funding source, which was ultimately exited.
By year-end, the portfolio reflected a deliberate overweight equity exposure of 45.5% (v. 40% neutral weight). The remaining asset allocations by year-end were 50.8%% Fixed Income, 2.4% Cash, and 1.3% Commodities with duration near 3.6 years, and a forward yield of 4.5%. These adjustments positioned the strategy for continued resilience through potential late-cycle volatility.
Figure 2: Tactical Income 4Q25 Sector Allocation Changes
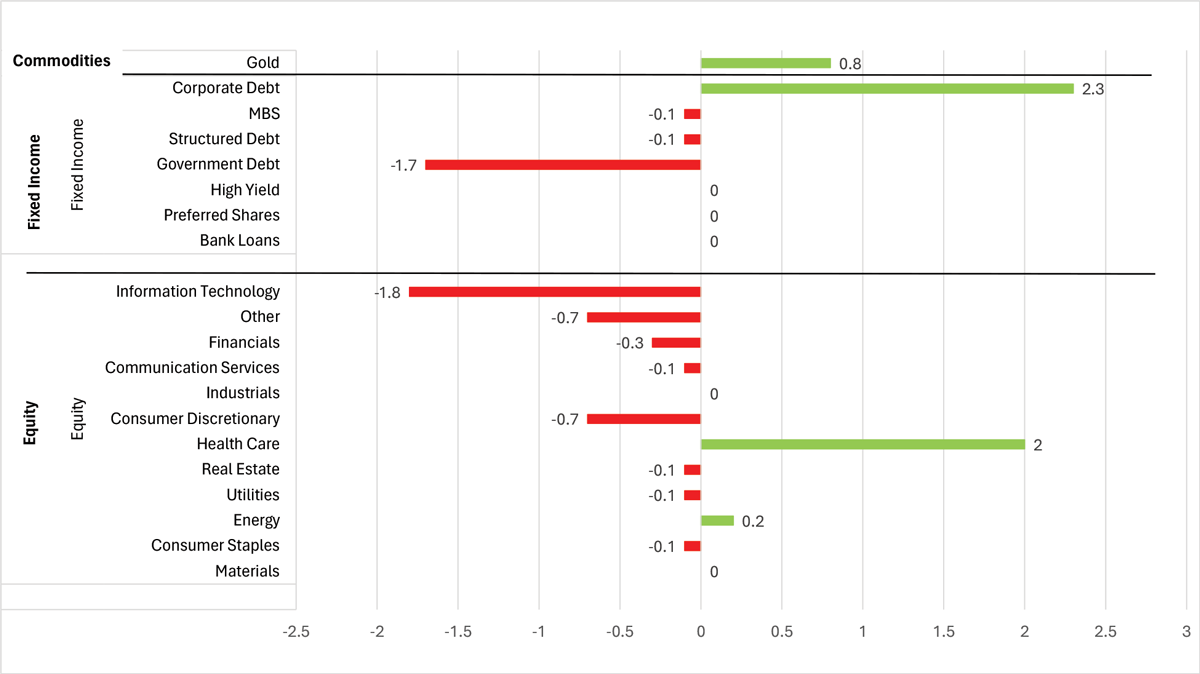
Figure 2: Tactical Income 4Q25 Sector Allocation Changes
Source: Bloomberg as of 12/31/25
Quick Snapshot of 4Q Attribution:
- Average Asset Allocation During 4Q25: 46% Equity, 51% Fixed Income, 2% Cash, 1% Commodities.
- Yield on Portfolio as of 12/31/25 was 4.4% with the fixed income side of the portfolio at 4.9% yield to maturity.
- The Hilton Tactical Income Composite returned 1.91% gross / 1.77% net and modestly beat the benchmark* return of 1.78% by 13 basis points.
- The equity contribution to return was 1.1%, which 5bp ahead of the equity portion of the benchmark*.
- GOOGL (+80bp), LLY (+30bp), AZN (+19bp), APPL (16bp), CSCO (+12bp), PLD (+10bp), CAT (+8bp), and AMGN (+8bp), were key contributors to performance.
- Fixed Income holdings contributed +0.63%, which slightly trailed the benchmark of 0.72% for the fixed income portion due to our lower allocation weight (51% v. 60% bench).
- The average duration of the fixed income portfolio was 3.6 with an average credit rating of A.
Market Outlook:
Looking ahead to 2026, we expect the investment landscape to become less dominated by a single theme and more defined by dispersion across sectors, balance-sheet quality, and return on invested capital. While secular forces remain supportive of growth, the next phase of the cycle is likely to reward selectivity over broad beta exposure.
AI CapEx: Growth Continues, but at a Slower and More Discriminating Pace.
We continue to view artificial intelligence as a durable, multi-year secular driver; however, we expect the rate of AI-related capital expenditure growth to moderate following several years of extraordinary acceleration. After exceeding $500 billion in global spend in 2025, projections for $700+ billion in 2026 remain robust, but we believe incremental growth will increasingly be constrained by balance-sheet capacity, funding costs, and return thresholds.
Rising leverage, higher real rates, and greater scrutiny of monetization timelines are beginning to weigh on both public and private market participants. In the private markets in particular, lower realized ROIC and tighter funding conditions are likely to slow deployment and reduce risk tolerance, especially for long-dated infrastructure projects with uncertain payback periods. As a result, we expect capital to become more selective, favoring AI enablers with strong cash generation, pricing power, and funding flexibility over highly levered, capital-intensive models.
Broadening Market Leadership Beyond AI.
As AI-driven CapEx growth normalizes, we believe market leadership will broaden meaningfully into non-AI sectors, particularly those offering defensive growth and valuation support. Healthcare stands out as a prime beneficiary of this rotation. After multiple years of underperformance and significant estimate resets, healthcare equities now offer attractive risk-adjusted return profiles, supported by durable demand, improving pipelines, and limited sensitivity to capital-spending cycles.
Consumer Outlook: Tax Refunds as a Near-Term Tailwind.
On the consumer front, we see scope for a modest rebound in discretionary spending, supported in part by a more robust tax refund cycle. After several years of elevated inflation eroding real purchasing power, many consumers are entering 2026 with slowing inflation and incremental liquidity from refunds. While this is unlikely to drive a return to pre-pandemic consumption excesses, it should provide a near-term tailwind for select consumer discretionary segments, which have been among the most heavily discounted areas of the equity market.
Rates, Policy, and Risk Assets.
We continue to expect a gradual easing cycle rather than aggressive rate cuts, with inflation likely to remain above pre-COVID norms. In this environment, long-duration assets may remain capped, while short-to-intermediate duration carry and high-quality income continue to offer attractive risk-reward. Importantly, easing policy combined with stable financial conditions should provide a supportive backdrop for equities, even as leadership becomes more balanced.
While 2025 was a year where discipline carried a visible opportunity cost, we remain confident that mandate consistency, volatility control, and income durability are the correct foundations for long-term compounding. Periods where market returns are driven by a narrow group of high-volatility equities are precisely the environments where risk management matters most, even when it is temporarily out of favor.
We appreciate your continued trust and partnership and look forward to navigating 2026 with the same focus on transparency, discipline, and thoughtful capital allocation.
Sincerely,
The Hilton Tactical Income Investment Team
*Primary Benchmark = 40% SPX TR Index / 60% Bloomberg Intermediate US Govt/Credit TR Index Value Unhedged
1 S&P 500 Dividend Aristocrats (+6.8%) and Schwab US dividend Equity ETF (+4.3%). These are two of the largest 100% equity dividend funds in the US. Source Bloomberg
2 TI’s dividend yield was higher than treasuries at the end of the year (+4.4% v. 4.1%). Source Bloomberg
Important Disclosures:
Hilton Capital Management, LLC (“HCM”) is a Registered Investment Advisor with the US Securities Exchange Commission. The firm only transacts business in states where it is properly notice-filed or is excluded or exempted from registration requirements. Registration as an investment advisor does not constitute an endorsement of the firm by securities regulators nor does it indicate that the advisor has attained a particular level of skill or ability.
The views expressed in this commentary are subject to change based on market and other conditions. The document contains certain statements that may be deemed forward looking statements. Please note that any such statements are not guarantees of any future performance and actual results or developments may differ materially from those projected. Any projections, market outlooks, or estimates are based upon certain assumptions and should not be construed as indicative of actual events that will occur.
All information has been obtained from sources believed to be reliable, but its accuracy is not guaranteed. Sources include: Bloomberg and INDATA (our portfolio accounting and performance system). There is no representation or warranty as to the current accuracy, reliability or completeness of, nor liability for, decisions based on such information and it should not be relied on as such.
The S&P 500 Total Return Index, often referred to as SPX TR, is a version of the S&P 500 index that includes both capital gains and dividends. Unlike the standard S&P 500 Price Return Index (SPX), which only reflects changes in stock prices, the SPTR reinvests dividends paid by the companies in the index, providing a more comprehensive measure of investment performance. We believe that this makes it a better benchmark for evaluating the actual returns an investor might receive.
The Bloomberg Intermediate US Government/Credit TR Index Value Unhedged Index is a broad-based benchmark that measures the non-securitized component of the Bloomberg US Aggregate Index with maturities less than 10 years. It includes: investment-grade, US dollar-denominated, fixed-rate Treasuries, government-related securities, and corporate bonds. The "Total Return (TR)" aspect means it includes interest income and price appreciation. "Unhedged" indicates that it does not use currency hedging, which is relevant for international investors.
The Morningstar Moderately Conservative Index represents a diversified portfolio of: global equities, bonds, and traditional inflation hedges such as commodities and TIPS (Treasury Inflation-Protected Securities). It is designed for U.S. investors seeking slightly below-average exposure to equity market risk and returns. The portfolio maintains a static allocation, typically targeting around 40% equity exposure, making it suitable for moderately conservative investment strategies.
The composite performance information contained herein is unaudited, was calculated by HCM and is shown on both a gross-of-fee and net-of-fee basis. The performance results herein include the reinvestment of dividends and/or other earnings, and the net-of-fee performance results are shown net of the actual advisory fees paid by the client accounts in the HCM Tactical Income Composite. In addition, actual client accounts may incur other transaction costs such as brokerage commissions, custodial costs and other expenses. Accordingly, actual client performance will differ, potentially materially, particularly given that the net compounded impact of the deduction of investment advisory fees over time will be affected by the amount of the fees, the time period, and the investment performance. For additional information about the composite, please contact us - info@hiltoncm.com
All investing involves risks including the possible loss of capital. Asset allocation and diversification does not ensure a profit or protect against loss. Please note that out- performance does not necessarily represent positive total returns for a period. There is no assurance that any investment strategy will be successful. All investments carry a certain degree of risk. Dividends are not guaranteed, and a company’s future ability to pay dividends may be limited.
Additional Important Disclosures may be found in the HCM Form ADV Part 2A, which can be found at https://adviserinfo.sec.gov/firm/summary/116357.